
Figure 2.
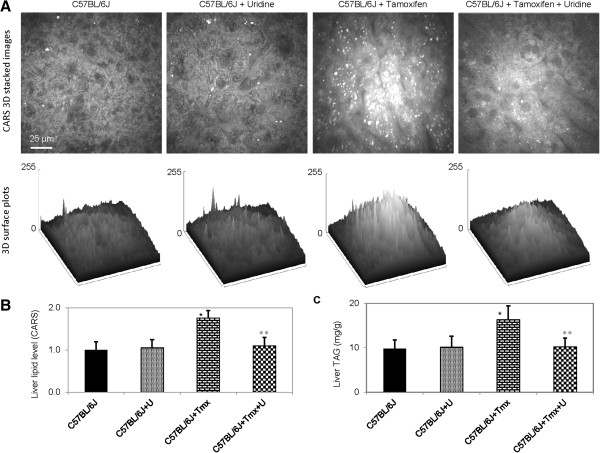
Uridine prevents tamoxifen-induced fatty liver. (A) CARS images (upper panels) and 3D surface plots of lipid distribution of C57BL/6J liver tissues as a function of uridine and/or tamoxifen treatment. (B) Liver lipid level determined with CARS image analysis. (C) Liver triacylglyceride (TAG) levels determined with biochemical assays. Error bars are standard deviation values across 9 mice analyzed per animal group. Single asterisk (black) indicates p-value < 0.05 versus untreated control mice. Double asterisks (gray) indicate p-value < 0.05 versus C57BL/6J mice treated with tamoxifen.