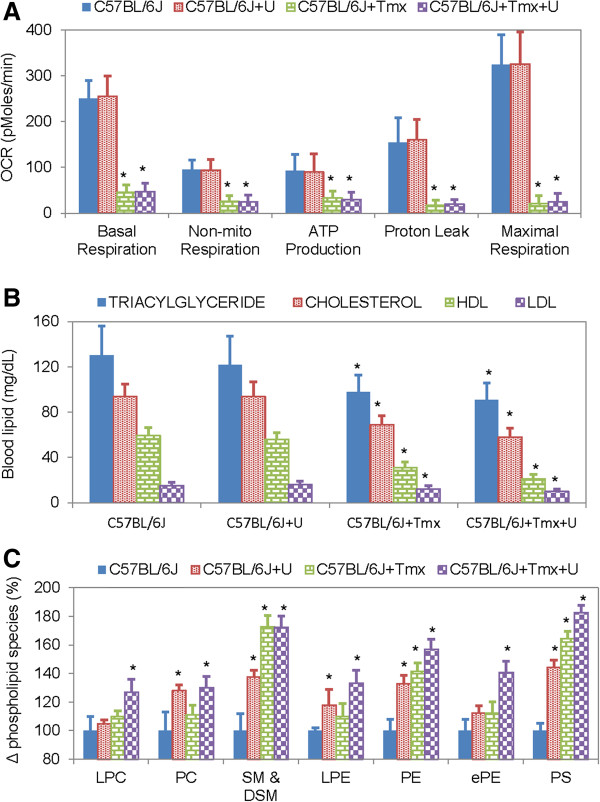
Figure 4.

Effects of uridine and tamoxifen on hepatocyte mitochondrial respiration, blood lipid level, and liver phospholipid level. (A) Oxygen consumption rate (OCR) of primary hepatocytes measured with an Extracellular Flux Analyzer. Error bars are standard deviation values across 24 repeated measurements per experimental condition. (B) Blood levels of triacylglyceride, cholesterol, high-density lipoprotein (HDL), and low-density lipoprotein (LDL) determined via direct measurements. (C) Changes in selective phospholipid species as a function of uridine and/or tamoxifen treatment. Lysophosphotidylcholine (LPC); phosphotidylcholine (PC); sphingomyelin (SM) & dihydrosphingomyelin (DSM); lysophosphoethanolamine (LPE); phosphoethanolamine (PE); ether-linked phosphoethanoamine (ePE); phosphatidylserine (PS). Error bars are standard deviation values across 6 mice analyzed per animal group. Asterisks indicate p-value < 0.05 versus untreated control mice.
