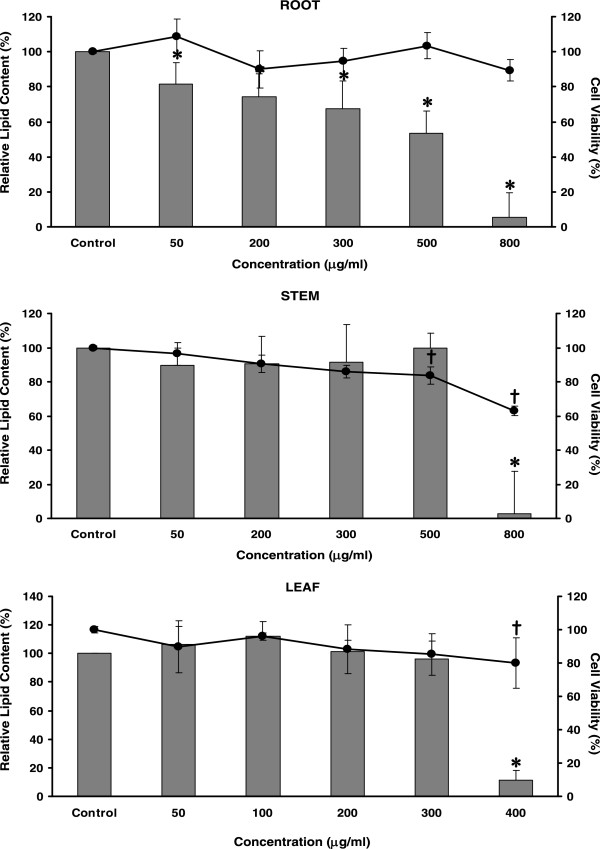
Figure 1.

Effects of an ethanol extract from different parts of ivy gourd on intracellular lipid accumulation and cell viability. Results are given as a mean value ± S.D. of six-replicate measurements. Bar graphs represent the relative intracellular lipid contents. Asterisks indicate a significant difference at p <0.05 from the untreated control (0 μg/mL). Percentages of cell viability are shown as a line graph. Crosses indicate a significant difference at p <0.05 from the untreated control (0 μg/mL). The standard TNFα at 10 ng/mL gave 5.00 ± 1.74% of relative lipid content in these experiments.
