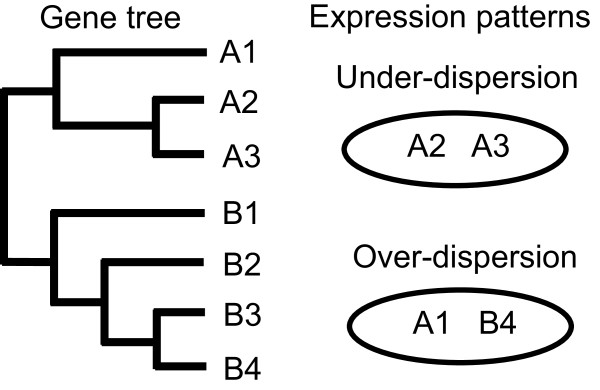
Figure 1.

Schematic of modes of expression patterns of genes in a single species. On the left is a hypothetical gene tree for seven members of a gene family that occur in the genome of a species. Genes in each clade (A and B) are labeled with the clade name and a number (e.g. genes A1, A2 and A3 in clade A). The circles on the right indicate possible scenarios for gene expression in the species (if only two genes are expressed). Expression of the A2 and A3 genes simultaneously represents the scenario of under-dispersed expression in which the sequence disparity of these two genes is smaller than random; expression of the A1 and B4 genes represents over-dispersed expression because of the disparity of these two genes.
