
Figure 1.
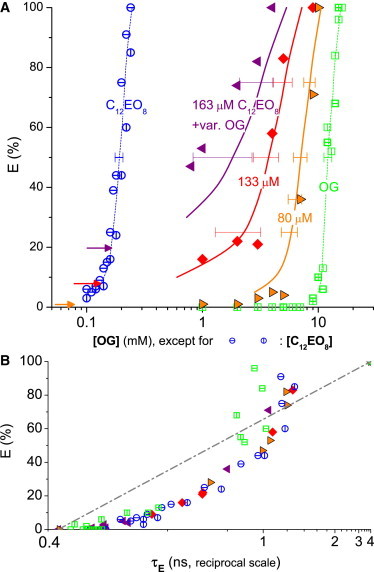
Leakage data for C12EO8 (open circles; horizontal and vertical bars distinguish independent measurements), octyl glucoside (OG, open squares), and mixtures thereof (solid symbols) acting on 300 μM POPC vesicles. (A) Dye efflux after 1 h, E, as a function of the concentration of OG (for pure OG and mixtures) or C12EO8. (Solid symbols) Mixtures of three series with constant C12EO8 of 163 μM (left-pointing triangles), 133 μM (diamonds), and 80 μM (right-pointing triangles), respectively, and variable OG (see abscissa); the leakage values corresponding to these concentrations of C12EO8 alone are marked (arrows). (Solid lines) Values calculated using Eq. 3 assuming additive action (CI = 1) (dashed lines are to guide the eye only); all mixtures act additively within error. (B) E as a function of the fluorescence lifetime of entrapped dye, τE, on a reciprocal scale. To see this figure in color, go online.