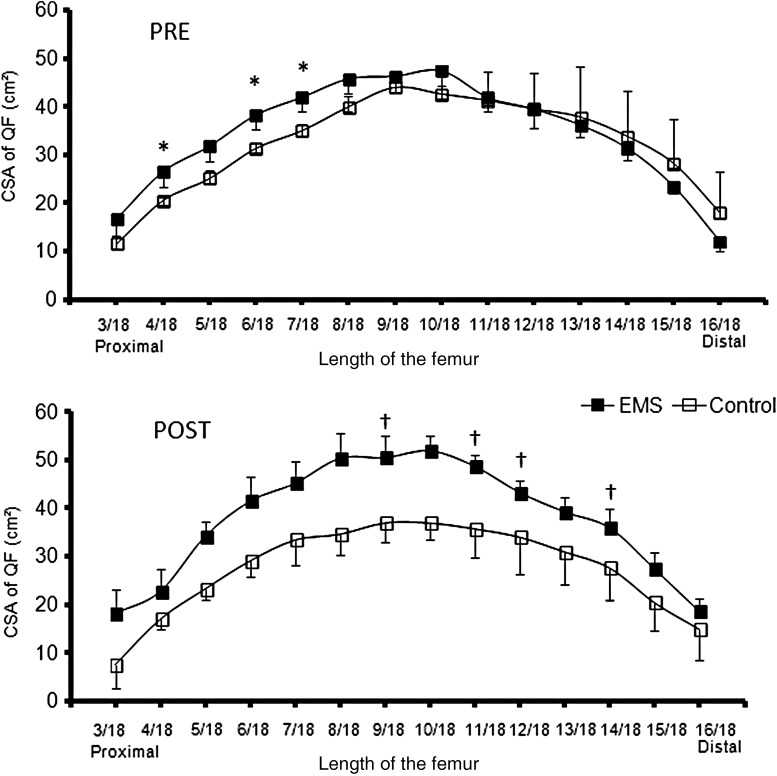
Figure 3.
Quadriceps femoris CSA (mean ± SD) for length of femur 3/18 to 16/18 before (Pre) and after (Post) electrical-stimulation training for the intervention (EMS, filled boxes) and control group (empty boxes). *P < 0.05 intervention vs. control values at Pre. †P < 0.05 intervention vs. control percentage of change from PRE to POST.

