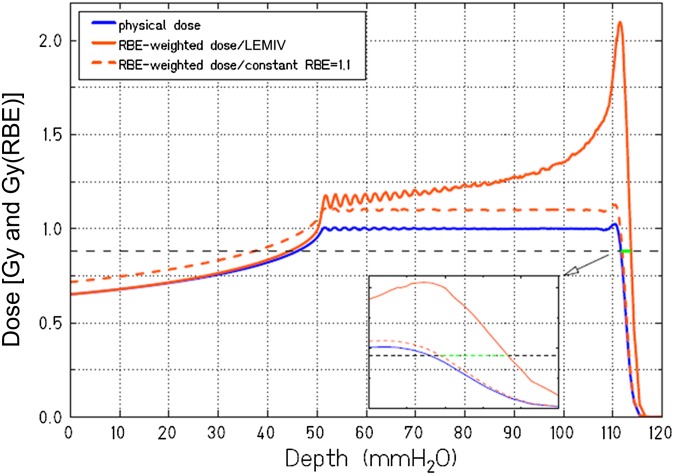
Figure 2.
Biological range extension owing to a variable relative biological effectiveness (RBE) with depth in proton therapy. The orange dashed line indicates the corrected physical spread-out-Bragg-peak using the conventional RBE = 1.1. The orange line represents the correction used with the Local Effect Model version IV (LEMIV) model.20,21 The black dashed line indicates 80% of the prescribed RBE-weighted dose. The inset shows a zoom of the distal penumbra, and the green line shows the increased range predicted by the biological model. Image and calculation courtesy of Rebecca Grün, GSI, Darmstadt, Germany. Modified with permission from the American Association of Physicists in Medicine.18

