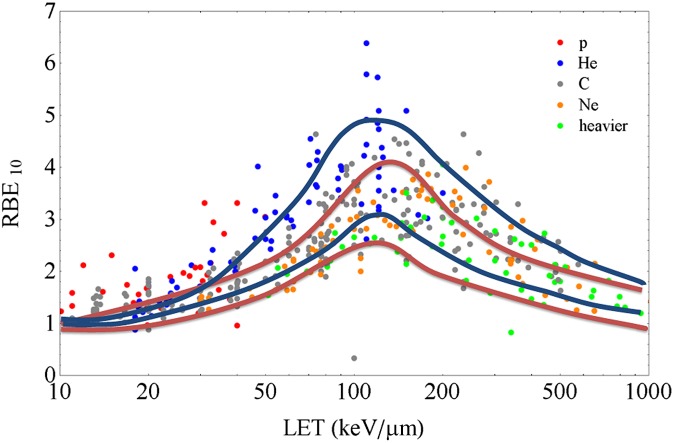
Figure 3.
Variability of the relative biological effectiveness (RBE) (calculated at 10% survival level) vs linear energy transfer (LET) (dose-averaged in water, in keV μm−1) in vitro data. Points are extracted from the large Particle Irradiation Data Ensemble (PIDE) database (https://www.gsi.de/bio-pide) developed at GSI, Darmstadt, Germany.24 Different colours correspond to different ions as shown in the legend. The blue curves describe the approximated band of Chinese hamster V79 survival data as collected from Sørensen et al.25 The red curves include the data on different in vitro cell lines collected at Lawrence Berkeley Laboratory.14 DC, dendritic cell.

