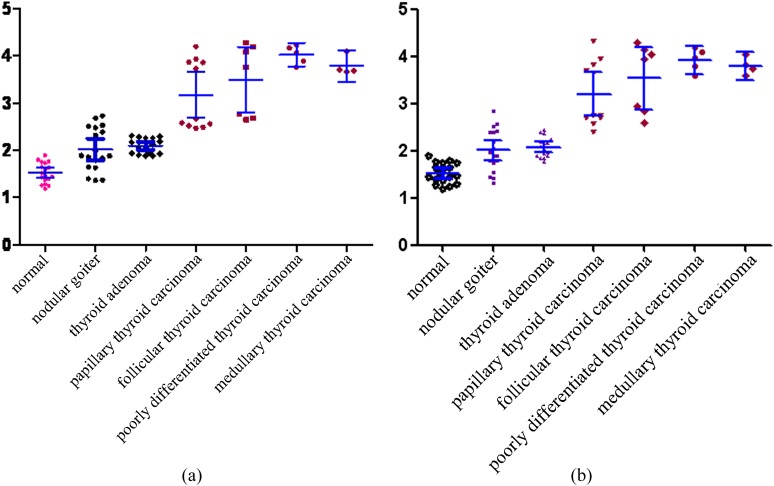
Figure 1.
(a) The central group; (b) The periphery group. Acoustic radiation force impulse (ARFI) values of the central and periphery groups in all nodules; the wave velocity range of the malignant thyroid nodule group was significantly higher than the control group and the benign group. (a) Scatter plots of ARFI values for benign and malignant thyroid nodules in the centre. The long horizontal bar shows mean value, and the two short horizontal bars show the standard deviation (SD). (b) Scatter plots of ARFI values for benign and malignant thyroid nodules in the periphery. The long horizontal bar shows mean value, and the two short horizontal bars show the SD.

