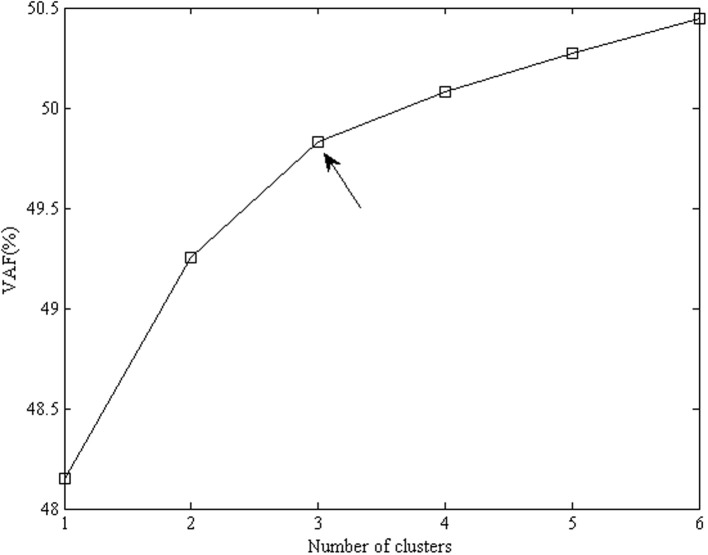
Figure 1.
Percentage of explained variance for clusterwise SCA-P solutions for the emotional acculturation data, with the number of components equal to 2 and the number of clusters varying from 1 to 6. The favored number of clusters is 3 (indicated by the arrow), because the increase in fit levels off after three clusters.

