Figure 4.
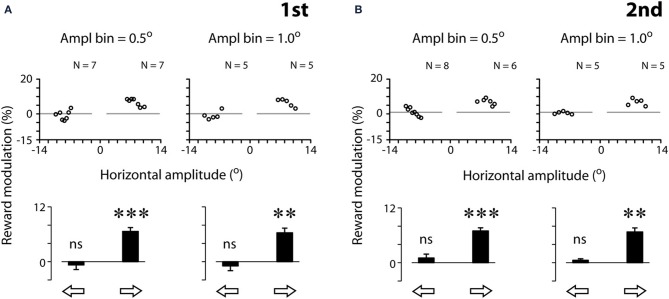
Quantification examples of reward modulation of saccadic velocities based on 2 different amplitude bin widths [0.5° (left panels) and 1.0° (right panels)], separated by the first (A) and second (B) tests. Reward modulation is plotted as the percent velocity change between rewarded and unrewarded saccades across the amplitude bins in the scatter plots (Equation 1, see Materials and Methods). The modulation across all scatter plot data per saccadic direction is plotted as a bar chart. Note that the data plotted were analyzed following the procedure of 3-point moving average (see Materials and Methods). The results without the procedure of 3-point moving average procedure are as follows. First test, 0.5°:  : −0.4 ± 4.3 (N = 7, P > 0.05),
  : 7.9 ± 4.7 (N = 7, P < 0.01); First test, 1.0°:
  : −0.1 ± 3.0° (N = 5, P > 0.05),
  : 7.0 ± 3.4 (N = 5, P < 0.05); second test, 0.5°:
  : 1.2 ± 5.1° (N = 8, P < 0.05),
  : 7.9 ± 6.1 (N = 6, P < 0.05); second test, 1.0°:
  : −1.4 ± 3.3° (N = 5, P > 0.05),
  : 7.0 ± 3.4° (N = 5, P < 0.05). Note that the resilience of the reward modulation remained in agreement with the data plotted, even though there was a significant increase in data variance without the 3-point moving average procedure. P < 0.05*; P < 0.01**; P < 0.001***, n.s.: P > 0.05. Data from subject F3.

