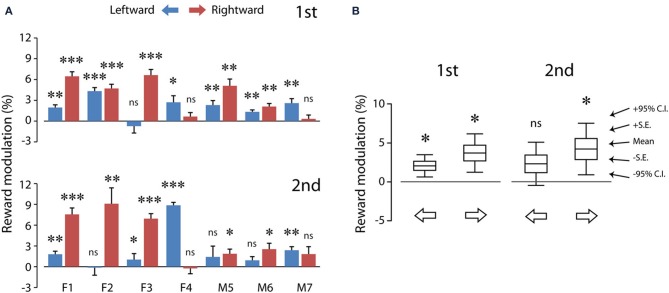
Figure 5.
The average reward modulation of saccadic velocities separated for saccadic directions of each subject (A) and the population averages of reward modulation across subjects (B). Data in (A) were quantified using the method shown in Figure 3 (see Materials and Methods; Equation 1), separated for test order (first: top; second: bottom). The data from each subject are plotted in paired color bars, for leftward (blue) and rightward (magenta) saccades, respectively. Note that, despite the individual differences in (A), the reward modulation was significant in the population averages in (B). P < 0.05*; P < 0.01**; P < 0.001***, n.s.: P > 0.05. C.I.: confidence interval.

