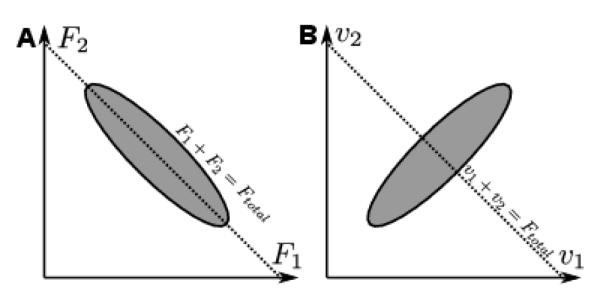
Figure 1.

The coordinate sensitivity of the UCM analysis. A: the inter-trial variance of two finger forces, F1 and F2, in a thought experiment involving the total force stabilization. The resulting ellipse is elongated along the UCM (dashed line), which corresponds to all finger forces whose sum equals the target value. B: the variance of the same data set as in A, but plotted in artificially constructed coordinates, v1 and v2 (see the text); the variance ellipse is oriented orthogonal to the UCM (dashed line). This example shows how the same data can be interpreted as stabilizing or destabilizing certain performance variable depending on the choice of the elemental variables. This property of the UCM analysis provides means for testing the plausibility of certain elemental variables being used by the CNS in the performance stabilization process.
