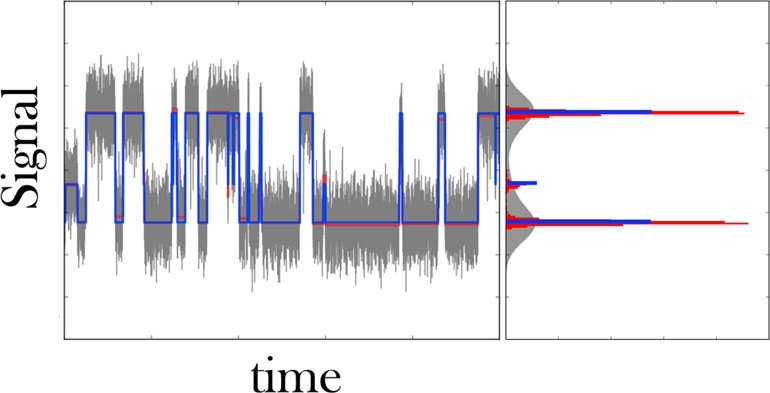
Figure 4.

We use a change-point algorithm to find transitions in the raw SM force spectroscopy data. Left: Typical time trace obtained by SM force spectroscopy in the passive mode35 showing the transitions between a zipped and unzipped state of an RNA hairpin. The high force (i.e., high signal) state coincides with the zipped state of the hairpin. The raw data are gray, and their associated histogrammed signal intensity, also gray, shows substantial overlap between low and high force states. We apply PELT,25 a change-point algorithm, and detect the steps in the data shown in red. The histogrammed signal intensity of this de-noised time trace still shows finite breadth. K-means++ is used to cluster each dwell to its closest cluster. Here we specified three clusters, since the red histogram has three well separated peaks. The resulting quantized steps are shown in blue, and the resulting signal histogram is, by construction, an infinitely sharp peak.
