
Figure 8.
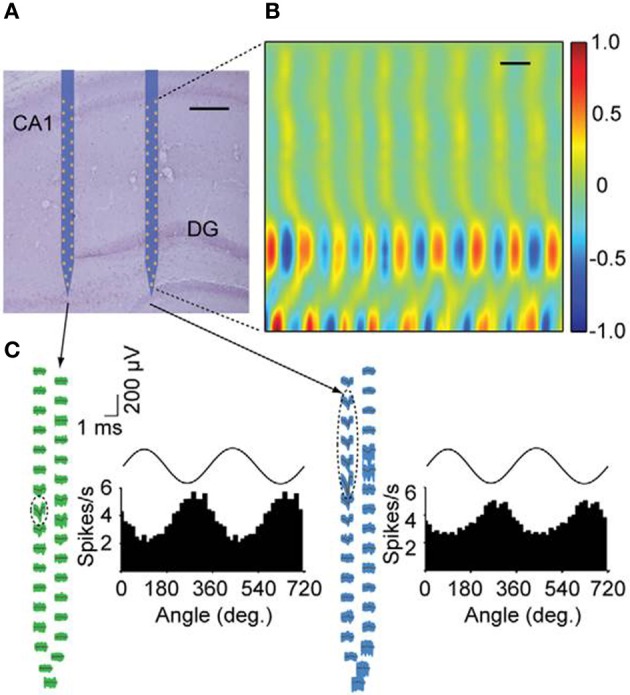
Simultaneous recordings of neurons with nanofabricated probes in awake behaving mice. (A) Nissl-stained brain section overlaid with a schematic of the probe at its stereotaxically implanted location. Each silicon shaft is 60 mm wide. Scale bar, 200 mm. (B) Current source density analysis of local field potentials across the hippocampus with a vertical resolution of 28 mm. DG, dentate gyrus. Neural data was collected during home cage exploratory behavior. Current source density is normalized to ś 1. Scale bar, 100 ms. (C) Waveforms of two putative single cells recorded with the nano-probe across all sites together with histograms showing theta phase locking of spikes. Dashed ellipses indicate the sites exhibiting the highest extracellular action potentials for these units. Theta oscillations shown on top of the histograms are for reference. Theta oscillations were measured from the upper rightmost electrode near the CA1 pyramidal cell layer (Adapted with permission from Du et al., 2011).