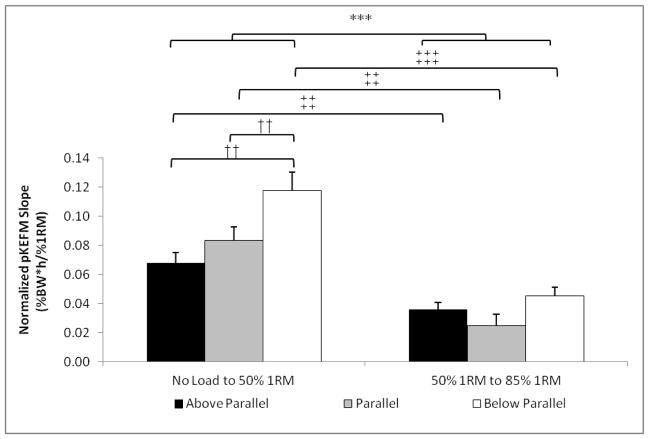
Figure 6.
Bar graphs of the slopes of the normalized peak external knee flexion moments (%BW*ht) vs. weight on the bar from Figure 4. Data are presented as mean ± SE (n = 16). Significant differences were observed in the average slopes across all depths (***, 0–50% vs. 50–85%, P < 0.001), between below parallel and the other depths when increasing from 0–50% (†† P < 0.01), and at each depth (0–50% vs. 50–85%, ‡‡ P < 0.01; ‡‡‡ P < 0.001).

