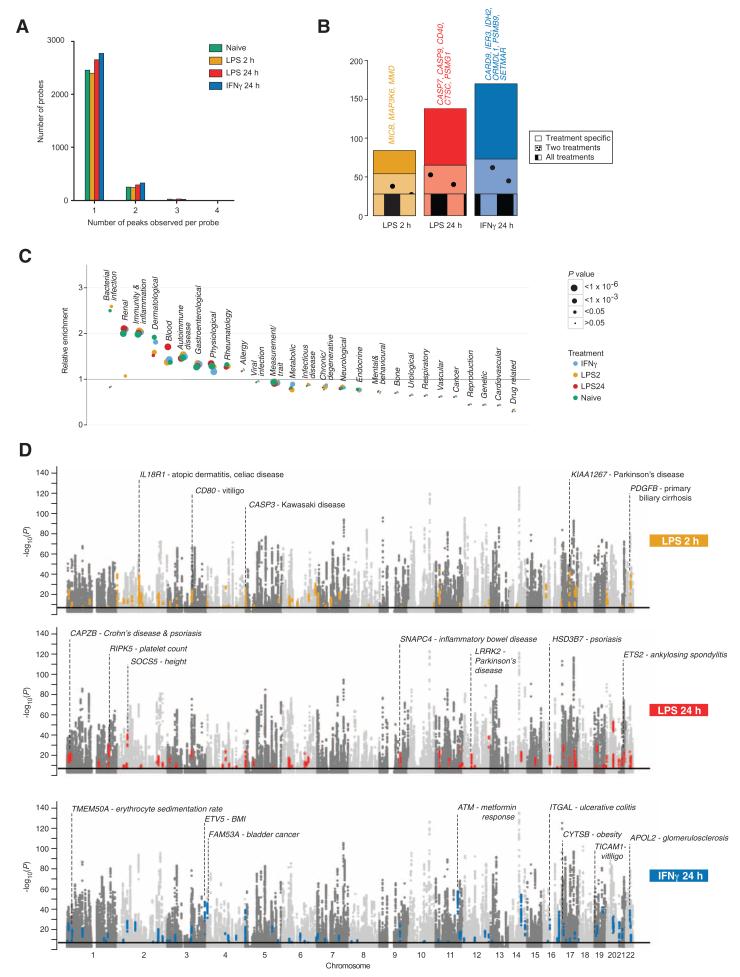
Fig. 5. Stimulus-specific eQTL and GWAS.
(A) Independent associations to the same probe within and between treatments were defined. The frequency distribution of the number of peaks observed per probe is shown by condition. (B) For genes showing an eQTL in naïve cells, the number of such genes with an additional stimulus-specific eQTL is shown according to stimulus and whether the eQTL were specific to that treatment or observed with two or all stimuli. Examples of immune relevant genes with second eQTL specific to a given stimulus are listed. (C) Enrichment analysis of treatment-specific eQTL by GWAS ontology category. (D) Manhattan plots demonstrating eQTL present in denoted treatment. Colored points correspond to eQTL where the primary peak is either a GWAS-identified locus or in r2 > 0.8 with a GWAS locus found in treated, but not naïve, monocytes.

