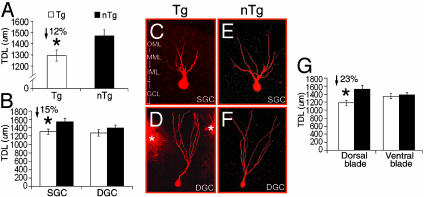
Fig. 2.
Comparison of the TDL of dentate GCs between Tg and nTg mice. (A) Genotype. A 12% reduction in TDLs of GCs occurred in Tg mice. (B) Cell type. A 15% reduction in TDLs of SGCs occurred in Tg mice, whereas no significant difference was found in DGCs. (C and D) Dendritic morphology of GCs of Tg mice. (E and F) Dendritic morphology of GCs of nTg mice. Note: SGCs of Tg mice exhibited a significant reduction in dendritic trees in comparison with that of nTg mice (C vs. E), whereas no difference was found for DGCs (D vs. F). Asterisks indicate surrounding DiI clusters. (G) Topographic location. The reduction in TDLs was increased up to 23% in the dorsal blade of Tg mice. No difference was found in the ventral blade of the DG.

