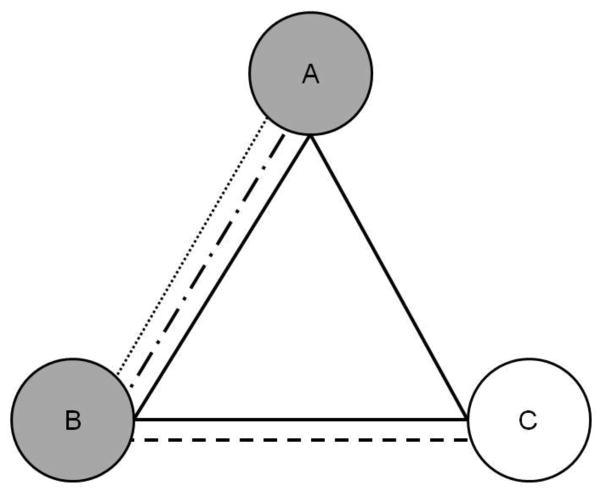
Figure 1. Simplified calculation of care density.
Doctors are represented by circles (A to C) and patients by different lines styles (solid, dashed). The patient represented by the solid line saw all three doctors. The weight (strength) of connections between a pair of doctors is the number of shared patients. Doctor pair AB is given a weight of 3, pair BC a weight of 2, and pair AC a weight of 1. Care density for the solid line patient represents the sum of the weights of his/her doctor pairs (AB + BC + AC=3 + 2 + 1) divided by the number of doctor pairs he/she sees (3). This yields a care density of 2. In sensitivity analyses, we examine the care density among a patient’s primary care and oncology specialists. If the primary care and oncology specialists are shaded gray in the Figure, then the care density for the patient represented by the solid line would be the weight of AB (3) divided by 1 pair of doctors equaling a care density of 3.

