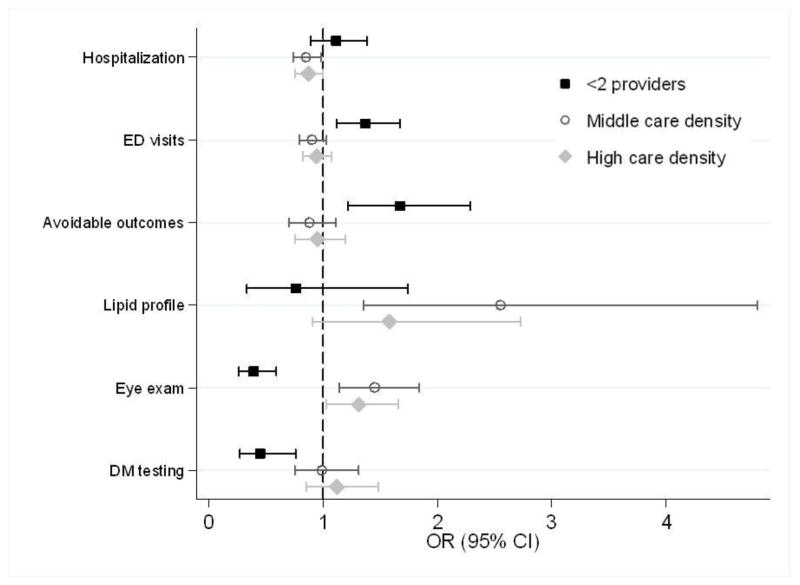
Figure 2.
Multivariable logistic regression analyses showing the association between care density and outcomes. The comparison group contains patients in the lowest tertile of care density. Analyses are adjusted for age, gender, race, SEER site, cancer type, state buy-in, urban/rural residence, number of visits, PCP visit, and comorbidity.

