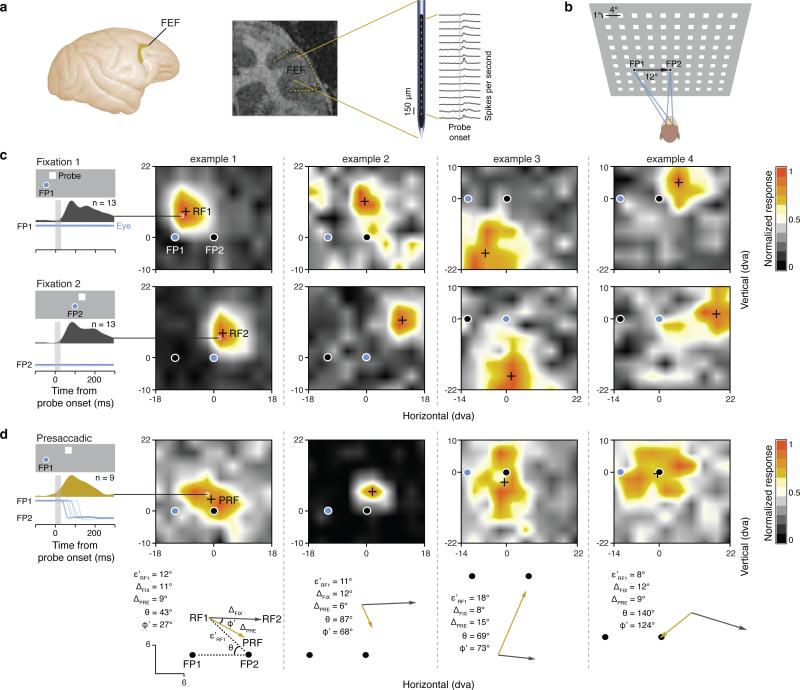
Figure 1. Multi-electrode recordings and high-density mapping of FEF neuronal RFs.
a, The FEF in the macaque cortex (left) and in a coronal magnetic resonance image from Monkey N (middle). Right, linear array microelectrode and traces of FEF visual responses recorded simultaneously across 16 electrode contacts. b, FEF RFs were mapped with a 10 by 9 array (36 by 32 dva) of probe stimuli (squares) flashed during fixation at FP1 and FP2 and immediately before saccades from FP1 to FP2. c, Four example neuronal RF maps. Left, mean peri-stimulus response histogram for the most effective probe location during fixation at FP1 (top) and FP2 (bottom). Blue traces and circles indicate eye position and fixation location, respectively. d, Presaccadic RF maps of the same neurons mapped immediately before saccades from FP1 to FP2. Left, mean peri-stimulus response histogram for the most effective probe location. Probe presentation (vertical gray shading) was completed prior to saccadic onset on all trials. Bottom, measurement of changes in RF centers (black crosses, RF1, RF2, and PRF) during fixation (gray vectors) and saccade preparation (gold vectors).

