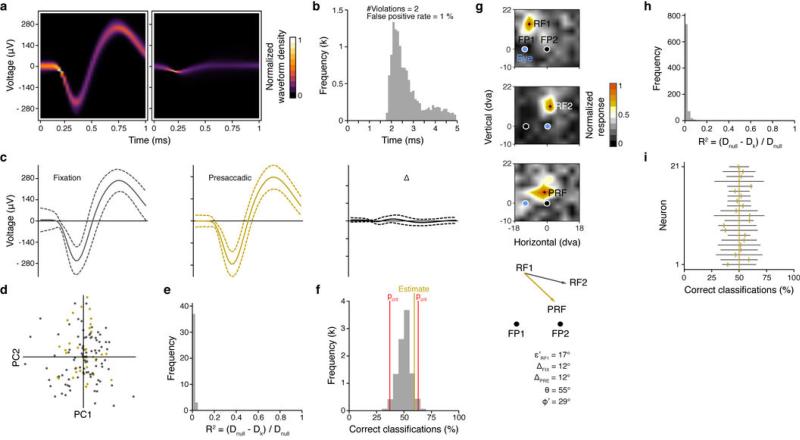
Extended Data Figure 7. Example of single neuron isolation, corresponding RF measurements, and waveform stability.
a, Density plot of isolated (left panel) and all other waveforms (right panel) recorded from a single U-Probe channel. b, Inter spike interval (ISI) histogram of the isolated waveform. The number of ISI violations and the estimated false positive rate are based on a refractory period of 1.5 ms. b, Averaged (arithmetic mean) waveforms (solid lines) for the fixation (left) and presaccadic (middle) condition, and their differences (right). Grey and gold dashed lines indicate 2 SDs. Black dashed lines enclose 95% confidence intervals. None of the depicted differences are statistically significant. d, Projection of fixation (grey) and presaccadic (gold) waveforms into principal component (PC) space. First two PC dimensions are shown. e, Distribution of Pseudo R2s (n = 40) resulting from logistic regression fits for each PC dimension in order to separate between fixation and presaccadic waveforms. Dnull designates the null deviance using the intercept in the regression exclusively. Dk designates the model deviance using a single PC dimension as predictor in addition. Perfect seperation would result in an R2 of 1. The mean of the depicted R2s is 0.01 (min = 2.9 · 10−6, max = 0.04). None of the R2s reached statistical significance (likelihood ratio chi square test). f, Performance of a linear support vector machine trained to discriminate between fixation and presaccadic waveforms using all 40 PC dimensions simultaneously. The estimated performance (gold line) of 59.4 % correct classifications falls well within the 95% range (37.1, 62.9) (red lines) of the expected chance performance. g, Fixation and presaccadic RF maps are shown together with their respective RF centers (black crosses, RF1, RF2, and PRF). Same conventions as in Figure 1. h, Histogram of the Pseudo R2s as obtained by logistic regressions for 21 neurons with stable waveforms. The mean R2 is 0.01 (min = 0, max = 0.23). None of the individual R2s reached statistical significance. i, Support vector machine classification performance of fixation and presaccadic waveforms for the same set of neurons. The mean correct classification performance is 50.1% (SD = 7.3). All performance estimates (gold ellipses) fall well within the expected ranges of chance performance (grey lines).

