
Extended Data Figure 9. Examples of RFs in which single probe results would be consistent with the remapping hypothesis.
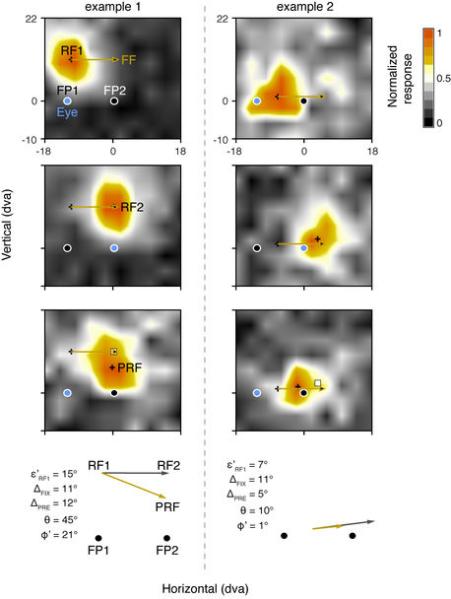
Two examples of RF maps in which the presaccadic RF converges toward the saccade target, rather than remap, yet it is clear that sampling of responses from only a single location would yield results consistent with remapping. In each example, the two fixation and one presaccadic RF response maps, and corresponding RF centers (black crosses, RF1, RF2, and PRF) are shown from top to bottom, respectively. As in previous figures, the blue filled circle indicates the location of fixation during probe presentation, though in the presaccadic RF plot the monkey is preparing a saccade to FP2 (target). In addition, in each plot, the gold arrow denotes the vector describing the RF shift expected with remapping if that shift is exactly equal to the saccade vector (as in most studies). In addition, indicated along with the PRF of each example is the location to which the RF1 center is expected to shift with remapping if the location is based on the empirically mapped postsaccadic RF (RF2) (white square). Since FEF RFs are retinocentric, both predictions are virtually the same, but shown for clarity. Note that in both examples, although the PRF clearly deviates from the remapping prediction overall, the predicted remapping location nonetheless yields a clear visual response. Thus, if only a single probe is used, the results would be consistent with the remapping hypothesis. The vector plots below show the comparison of the empirical remapping prediction based on RF2 with the measured PRF shifts. Conventions are as in Figure 1.