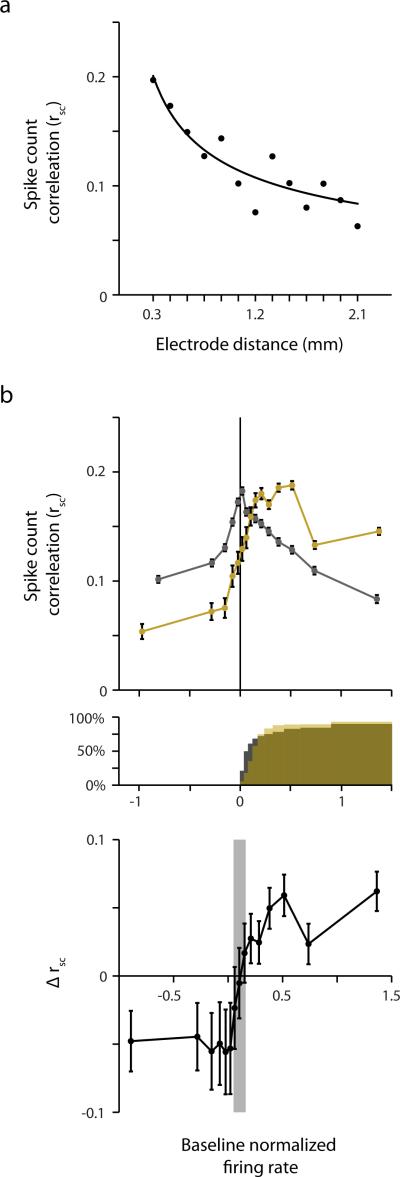
Extended Data Figure 10. Spike count correlations of recorded FEF neurons.
a, Decrease in mean spike count correlation (rSC) as a function of electrode distance. Solid line denotes the best fitting power function (a·xb; a = 0.12, p < 10−10; b = −0.45, p < 10−10). Data points are averages across neuronal pairs (N = 677) recorded at a fixed electrode distance, across all probe locations and across all three experimental conditions (fixation 1, fixation 2, and Presaccadic). The number of neuronal pairs for each electrode distance, in order of increasing distance, was n = (128, 106, 92, 86, 68, 55, 44, 28, 24, 18, 14, 10, 4). Note that the fit was based on the non-averaged data. b, Top, Mean rSC plotted as a function of baseline normalized firing rate during fixation (gray) and prior to saccade onset (gold). Positive values on the abscissa indicate combined responses above baseline. Error bars indicate SEM. Number of combined responses, in order of increasing baseline normalized response, was n = (8805, 8805, 8806, 8804, 8806, 7738, 7737, 7738, 7737, 7737, 7738, 7737, 7738, 7737, 7737) for fixation, and n = (2827, 1742, 1416, 1185, 1144, 1026, 1298, 1655, 2511, 3876, 6013, 7342, 7679, 9013, 11329) for the presaccadic condition. Middle, cumulative percentage of paired neuronal responses for which each individual response exceeds baseline during fixation (gray) and prior to saccade onset (gold). Bottom, difference in the mean rSC during fixation and prior to saccades. Error bars indicate Bonferroni-corrected (15 comparisons) 95% confidence intervals. Gray area indicates non-significant differences.

