
Figure 4. Localization of probe stimuli by the population of recorded FEF neurons.
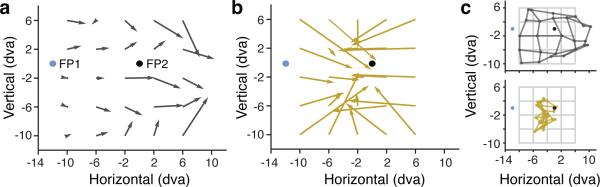
a, Population estimate of probe locations within a 16 by 16 dva area of visual space during fixation at FP1. Vector origins denote the veridical probe location and the endpoints the average population estimate. Vector lengths denote the errors, measured as the average Euclidean distance to the veridical probe location. b, Population estimate of probe locations during saccade preparation to FP2. c, Left, reconstruction of probe stimulus grid from population estimates during fixation (dark gray) and during saccade preparation (gold).