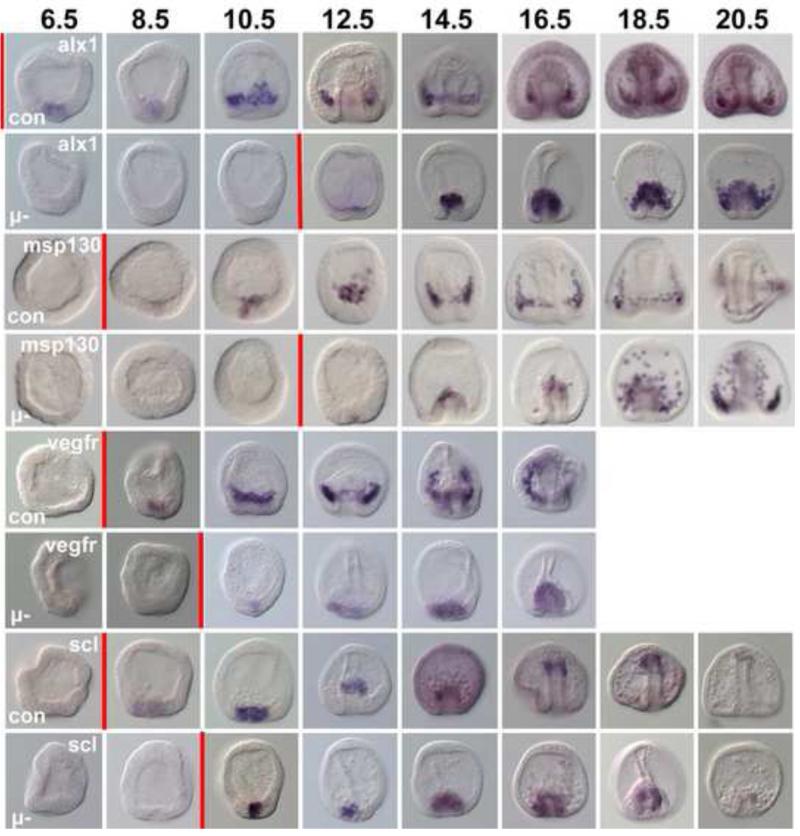
Figure 3.
Reprogramming occurs with compressed temporal dynamics. WMISH analysis of alx1, msp130, vegfr, and scl expression in control embryos (Con) and in micromere(−) (μ-) embryos over time. Numbers at top are hours post fertilization (hpf). Red vertical bars mark the approximate time each row demonstrated expression of the gene in question. First expression of alx1 in controls actually occurs at 4.5hpf (see Fig. 1C). As indicated by the red bars, in controls there is a 4 hr interval between expression of alx1 and msp130 and vegfr. In the reprogramming NSM cells alx1 is seen at 12.5hpf while msp130 is seen within an hour of that, and vegfr actually precedes expression of alx1 suggesting temporal compression relative to the sequence in normal development.

