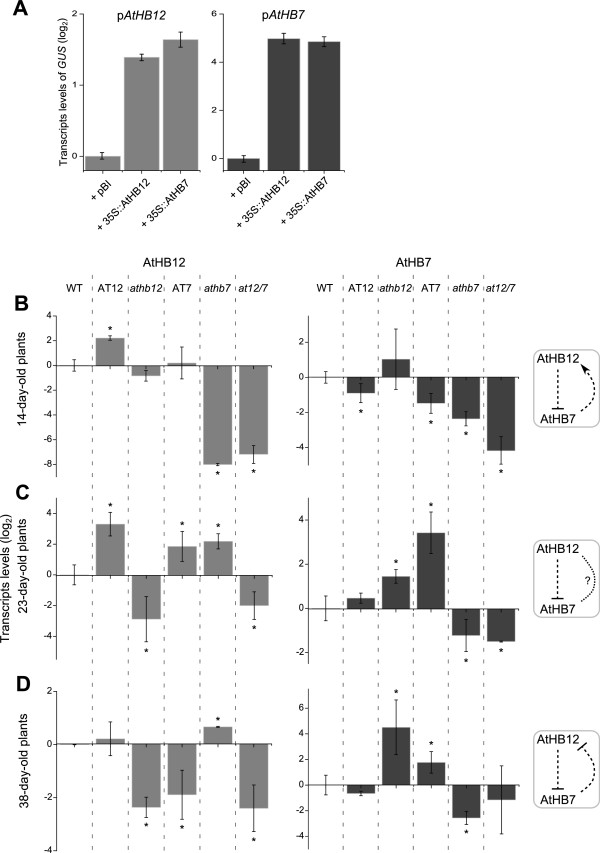
Figure 3.

AtHB12 and AtHB7 regulate each other along development in standard growth conditions. Total RNA was isolated from mutant and WT plants (indicated in the top). AtHB12 and AtHB7 transcript levels were analysed at three different developmental stages (14-, 23- and 38-day old plants); a scheme of the proposed effect of each TF on the other is shown on the right (positive → or negative --/ effect). (A) Transcript levels of GUS after transient co-transformation of N. benthamiana leaves with A. tumefaciens carrying pAtHB12::GFP::GUS or pAtHB7::GFP::GUS and the constructs indicated in the x axis, quantified by qRT-PCR. Values were normalised with respect to that measured in control samples (pAtHB12::GFP::GUS or pAtHB7::GFP::GUS + pBI 101.3) by ∆∆Ct method. (B) Transcripts levels in 14-day-old plants. (C) Transcripts levels in 23-day-old leaves. (D) Transcripts levels in 38-day-old leaves. Transcript levels were quantified by qRT-PCR and the values normalised with respect to that measured in WT plants applying the ∆∆Ct method. Error bars represent SE calculated from three independent biological replicates. Actin transcripts (ACTIN2 and ACTIN8) were used as a reference. “*” denotes statistical differences obtained with one-way-ANOVA-Tukey’s P < 0.05.
