Fig. 3.
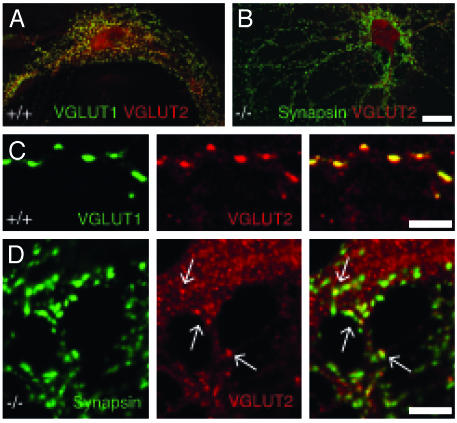
VGLUT1 and VGLUT2 expression in autaptic neurons. (A) VGLUT1+/+ neuron with strong staining for VGLUT1 (green) and VGLUT2 (red). Colocalization is shown in yellow. (Scale bar: 25 μm.) (B) VGLUT1-/- neuron with small EPSC that is weakly positive for VGLUT2 (red), apparent at higher magnification in D. Synapses are stained for synapsin (green). (Scale bar, 25 μm.) (C) High magnification of VGLUT1 (green) and VGLUT2 (red) colocalization (yellow) in the +/+ neuron from A. (Scale bar, 5 μm.) (D) High magnification of -/- synapses labeled for synapsin (green). Some synapses are also positive for VGLUT2 (red). Clearly VGLUT2-positive synapses are marked with arrows, and colocalization with synapsin is shown in yellow. (Scale bar, 5 μm.)

