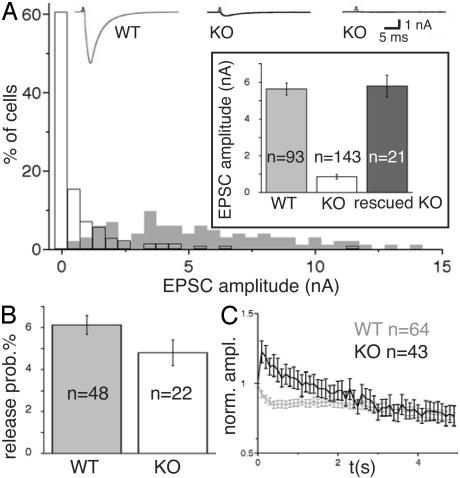
Fig. 4.
EPSC amplitudes and release probability. (A) Sample traces from WT and small response KO cells and distribution of EPSC amplitudes from WT (gray) and KO neurons. (Inset) Mean amplitudes of WT, KO, and KO neurons rescued with a VGLUT1 Semliki Forest virus. (B) Release probabilities calculated from the ratio of EPSC and readily releasable pool size. (C) EPSC amplitudes during a 10-Hz stimulation, normalized to the size of the first response.

