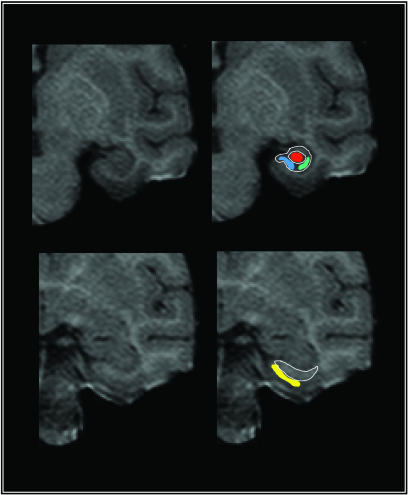
Fig. 1.
High-resolution images visualize individual hippocampal subregions. Maps of CBV were generated from T1-weighted images that possess high spatial and anatomical resolution. Images were acquired perpendicular to the hippocampal long axis, and the upper left image shows an example in which the hippocampal subregions can be visualized. The external morphology and the internal architecture of the hippocampus (white lines) are used as landmarks to segment the hippocampus into the subiculum (blue), the CA1 subfield (green), and the dentate gyrus (red). Note that border zones between the subiculum and CA1 subregion are excluded from analysis. The entorhinal cortex (yellow) is identified in more anterior images, as shown in the lower left image, relying on the underlying white matter and the collateral sulcus as anatomical landmarks.

