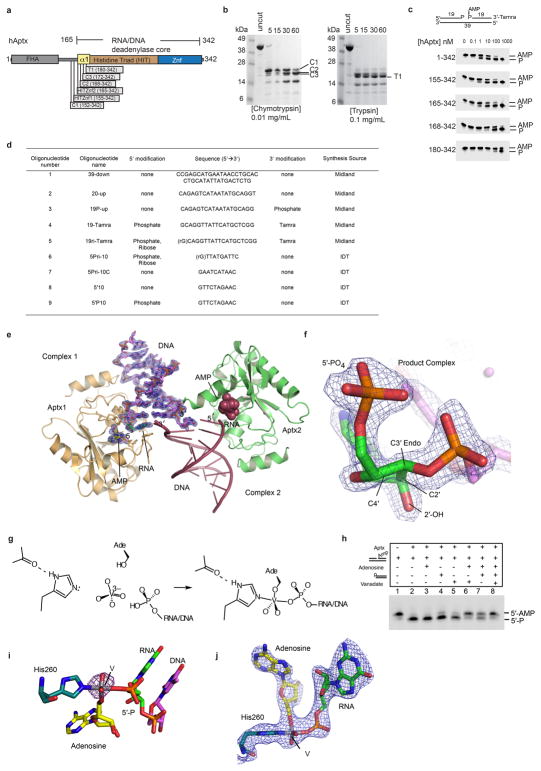
Extended Data Figure 3. hAptx domain mapping and structure determination.
a, Aptx protein domain schematic. b, Protease stable domains in hAptx were identified with limited tryptic and chymotryptic digests. (Left) Chymotryptic proteolysis of full-length hAptx produces clustered cut sites (C1 through C3) flanking the N-terminus of the hAptx histidine triad (HIT) domain helix. (Right) Tryptic proteolysis of full-length hAptx produces a major cut site (T1) near the N-terminus of the HIT domain. This analysis reveals a meta-stable HIT-Znf domain encompassing residues 152–342, and a chymotrypsin resilient core bounding residues 172–342. c, A comparison of the DNA 5′-deadenylation activities of the chymotyptic C2 fragment (aa 168–342), a smaller tryptic fragment (T1, aa 180–342) and two designed recombinant fragments (HIT-Znf1, aa 155–342, and HIT-Znf2, aa 165–342), shows that the HITZnf2 fragment, but not the smaller C2 and T1 fragments retain robust deadenylation activity. Further, the N-terminal boundary of the minimal catalytic domain in the absence of damaged DNA substrate is accessible to proteolytic digest. The HITZnf2 (165–342) fragment was used for crystallization studies. d, Table of crystallization and assay oligonucleotides. e, The product complex crystallographic asymmetric unit contains two copies of the Aptx/RNA-DNA/AMP/Zn complex. An omit (the RNA-DNA duplex and AMP were excluded from the model for electron density map calculation) σ-A weighted 1.95 Å Fo-Fc map is displayed contoured at 3.0 σ overlaid upon the AMP and RNA-DNA duplex for Complex 1. DNA unwinding of the terminal base pair also facilitates crystallization and formation of a one nucleotide base-pair between the two complexes. f. An omit (the RNA-DNA and AMP were excluded from the model for electron density map calculation) σ-A weighted 1.95 Å Fo-Fc map is displayed contoured at 3.5 σ overlaid upon the terminal 5′-rG, showing clearly the location of the 2′-OH and the C3′-endo sugar pucker of the 5′–terminal nucleotide. g, Assembly of the Aptx/AMP/RNA-DNA/Vanadate transition state mimic complex. Soaking of an adenosine RNA/DNA bound crystal form with orthovanadate facilitates an in crystallo reaction, and formation of the Aptx/AMP/RNA-DNA/Vanadate covalent complex. h, Adenosine and orthovanadate addition in the presence of a 5′-phosphorylated RNA-DNA duplex inhibits Aptx activity on 5′-AMPRNA-DNA, suggesting formation of a specific Aptx/RNA-DNA/adenosine/vanadate complex in solution. i. Model phased anomalous difference fourier for the transition state mimic complex is calculated from a 2.85 Å dataset for the transition state mimic complex crystal collected on the NIEHS rotating anode home source (λ = 1.5418 Å). A 3σ peak marks the position of the vanadium. j. Unbiased electron density for the enzyme-transition state mimic covalent complex. The σ-A weighted 2Fo-Fc electron density 2.5 Å map (contoured at 1.0 σ) is calculated using a model in which the displayed atoms were not included, and prior to refinement.

