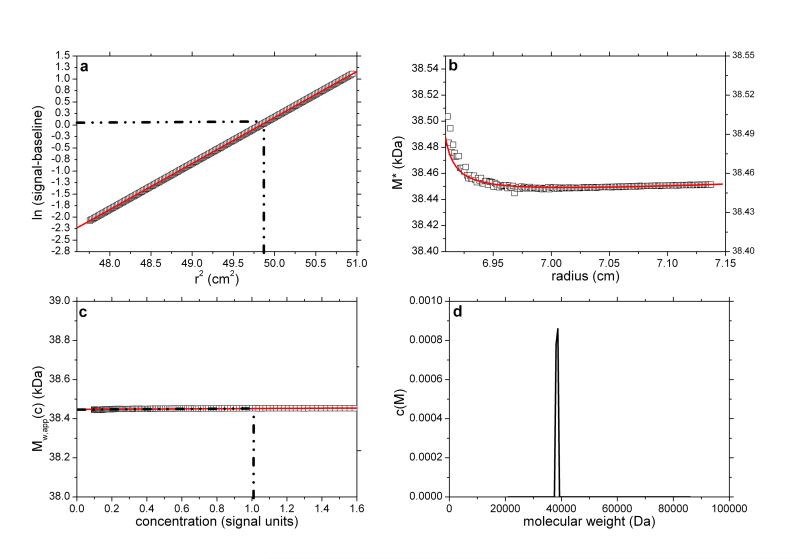
Fig. 1.
SEDFIT-MSTAR output for analysis on a simulation of a sedimentation equilibrium experiment for a single solute of molecular weight 38,450 Da (a) log concentration lnc(r) versus r2 plot, where r is the radial distance from the centre of rotation (open squares); and linear regression to highlight deviations from linearity arising from polydispersity and/or non-ideality (red line); (b) M* versus r plot (open squares) and fit based on the M* transformations of the c(M) fit of the raw data (red line): the value of M* extrapolated to the cell base = Mw,app, the apparent weight average molecular weight for the whole distribution. Retrieved value for Mw,app = 38,450 Da; (c) point or local apparent weight average molecular weight at radial position r (open squares) plotted against the local concentration c(r) for different radial positions: red line is the fit based on the equivalent transformation of the c(M) fit of the raw data (d) molecular weight distribution, c(M) vs M plot. The dot-dashed lines show the position of the hinge point (in panel (a)) and the corresponding estimation of Mw,app value (panel (c)), which also retrieves a value for Mw,app = 38,450 Da.

