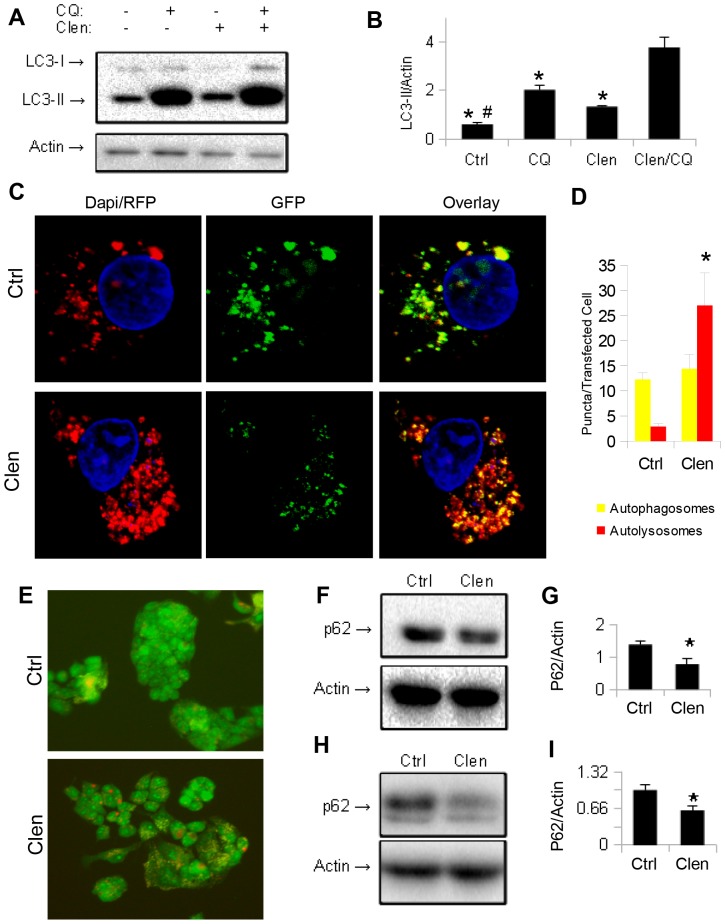
Figure 3. Clenbuterol increases autophagic flux in HepG2 cells and mouse primary hepatocytes.
A–B.) Co-treatment of HepG2 with Clenbuterol and Chloroquine shows a greater accumulation of LC3-II compared to control cells. Asterisk represents significance vs. Clen/CQ, and hash represents significance vs. CQ as per Tukey's post-hoc test following one-way ANOVA. C–D.) Clenbuterol increases autolysosomes in HepG2 cells transiently transfected with GFP-RFP-LC3 plasmid. Image taken at 40× magnification. E.) Clenbuterol increases lysosomal acidification (orange/red structures) in HepG2 stained with Acridine Orange. Image taken at 20× magnification. F–G.) Clenbuterol induces SQSTM1/p62 degradation in HepG2 cells. H–I.) Clenbuterol induces SQSTM1/p62 degradation in mouse primary hepatocytes. Error bars represent SEM. Unless otherwise noted, asterisk represents p<0.05 relative to control using Student's T-test.

