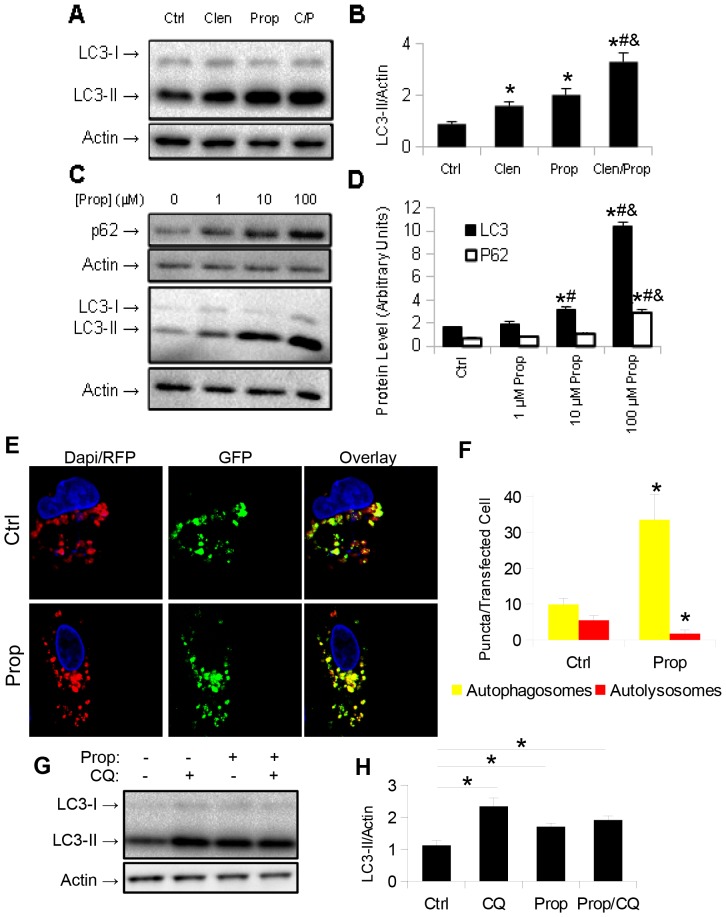
Figure 5. Propranolol inhibits autophagic flux in HepG2 cells.
A–B.) Propranolol increases LC3-II levels in HepG2 cells, even in the absence of adrenergic agonist. Asterisk represents significance vs. ctrl, hash represents significance vs. Clen, and ampersand represents significance vs. Prop as per Tukey's post-hoc test following one-way ANOVA. C–D.) Propranolol inhibits autophagic protein turnover in HepG2 cells. LC3-II and SQSTM1/p62 levels are increased with increasing doses of propranolol. Asterisk represents significance vs. ctrl, hash represents significance vs. 1 µM, and ampersand represents significance vs. 10 µM as per Tukey's post-hoc test following one-way ANOVA. E–F.) Propranolol increases autophagosome number, but decreases autolysosome number in HepG2 cells transiently transfected with GFP-RFP-LC3 plasmid. Image taken at 40× magnification. Asterisk represents p<0.05 as per Student's t-test with respect to control. G–H.) Co-treatment of HepG2 cells with chloroquine and propranolol shows no increased accumulation of LC3-II compared to control cells treated with chloroquine. Asterisk represents significance vs. ctrl as per Tukey's post-hoc test following one-way ANOVA. For all parts, error bars represent SEM.

