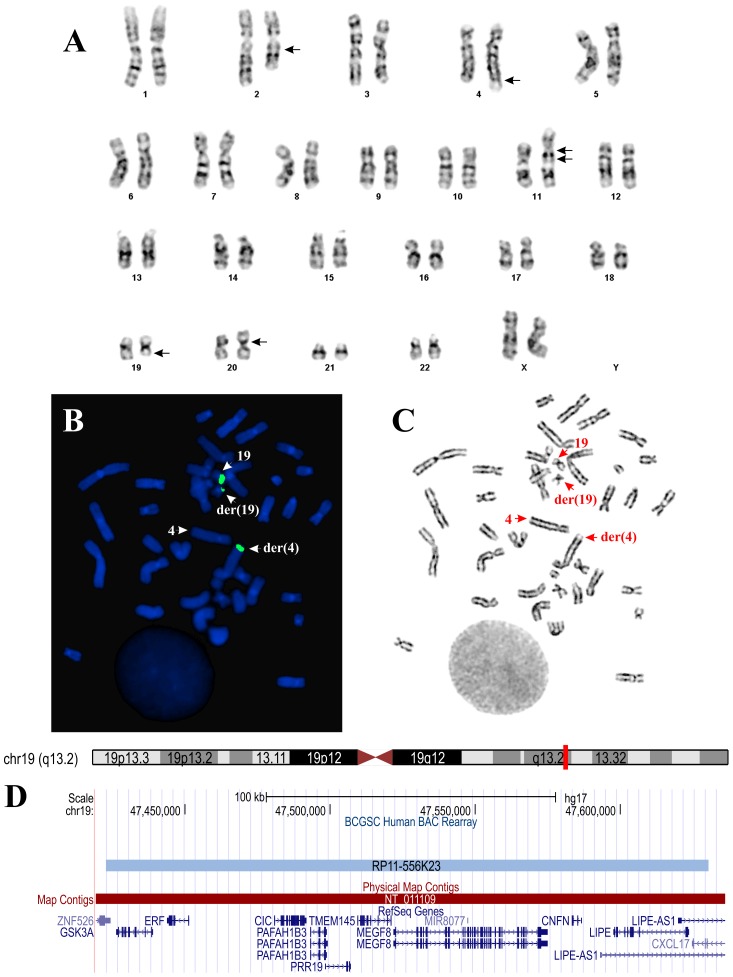
Figure 2. Cytogenetic and FISH analyses of the tumor.
A) Karyogram showing chromosome aberrations del(2)(q13q23), t(4;19)(q35;q13), ins(11;?)(q11;?), and der(20)?t(20;20)(p11;q11); breakpoints are indicated by arrows. B) FISH performed on metaphase spread using BAC RP556K23 (green signal) from 19q13 containing the CIC gene. A part from this probe has moved to the derivative chromosome 4. The der(4), der(19), and the normal chromosomes 4 and 19 are indicated by arrows. C) G- banding of the metaphase spread shown in (B). The der(4), der(19) and the normal chromosomes 4 and 19 are indicated by arrows. D) The location of the BAC RP556K23 on chromosome 19 and the genes found in this region. The data obtained from UCSC Genome Browser (http://genome.ucsc.edu/).

