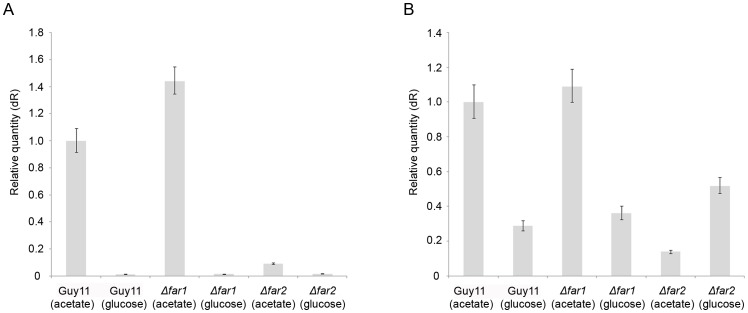
Figure 6. Bar charts to show gene expression profile of A. ACS2 and B. ACS3 acetyl CoA synthetase gene in Guy11 and the isogenic, Δfar1 and Δfar2 mutants.
Total RNA was extracted from fungal mycelium that was grown in complete medium for 48h and then transferred to minimal medium containing oleic acid or triolein for 24ACS2 and ACS3 was determined using quantitative real-time RT-PCR.

