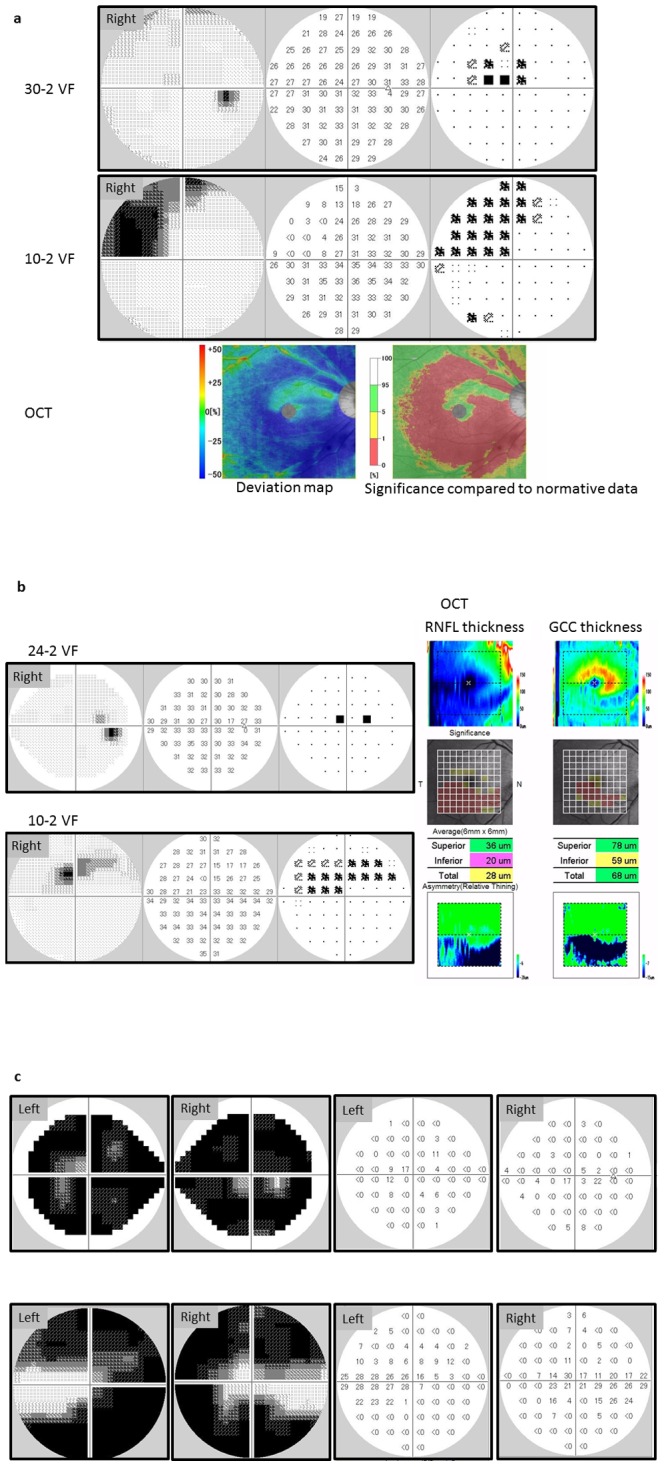
Figure 1. Case examples.

Case a: 61-year-old male (right eye, normal tension glaucoma) whose visual acuity was 20/20. The OCT image was obtained using the RS3000 (Nidek Co,.ltd, Gamagori, Aichi, Japan); blue colored regions in the OCT deviation map (left figure) indicate thinner RNFL+GCC than expected; significance is represented in the right figure (significant differences in thickness are colored in red). Case b: 60-year-old male (right eye, normal tension glaucoma) whose visual acuity was 20/20 (right eye). The OCT image was obtained using the 3D OCT-2000 (Topcon Corp, Tokyo, Japan), Case c: 69-year-old male (normal tension glaucoma) whose visual acuities were 20/32 (right eye) and 20/25 (left eye). OCT: Optical coherence tomography. RNFL: retinal nerve fiber layer, GCC: ganglion cell complex.
