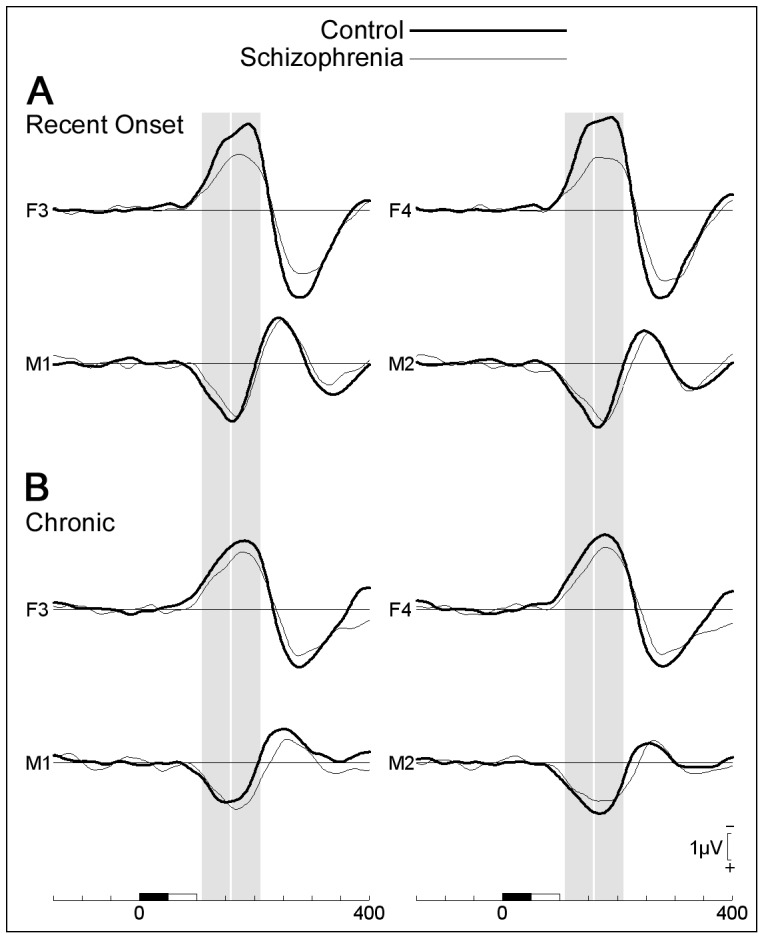
Figure 2. Comparison of MMN at frontal and mastoid sites in controls and patients with schizophrenia.

(A) Recent-onset groups; (B) Chronic groups. Shaded vertical bars represent intervals analysed and labelled early and late MMN.

(A) Recent-onset groups; (B) Chronic groups. Shaded vertical bars represent intervals analysed and labelled early and late MMN.