
Figure 2. The scheme of a histological slide shows a local bone defect in the proximal tibia.
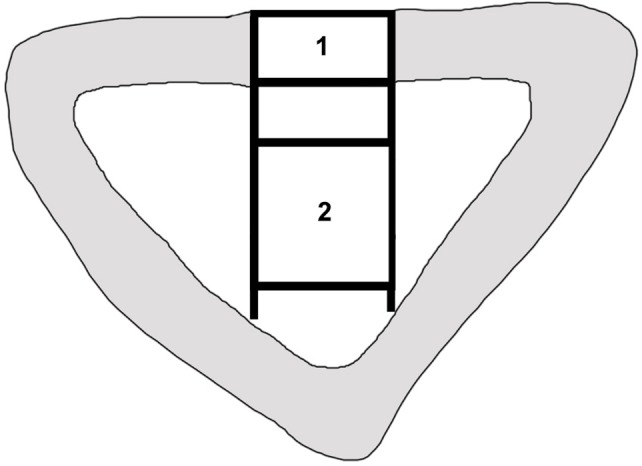
New bone formation was quantified histomorphometrically in two distinct regions of interest. 1. The cortical defect zone (size: 1500×7000 pixels). 2. The central defect zone (size: 3000×7000 pixels).