
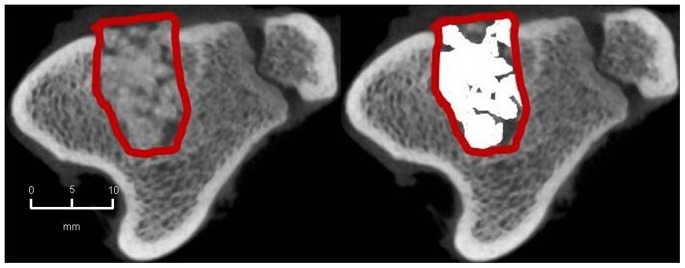
Figure 15. CBCT-volumetry of the tibial defect in axial images: BMC+CPG+PRP group: left: defect zone is identified (line), right: only areas with a density >2350 HU are opacified (white area), example of an animal with 80% bone defect consolidation.
Official websites use .gov
A
.gov website belongs to an official
government organization in the United States.
Secure .gov websites use HTTPS
A lock (
) or https:// means you've safely
connected to the .gov website. Share sensitive
information only on official, secure websites.