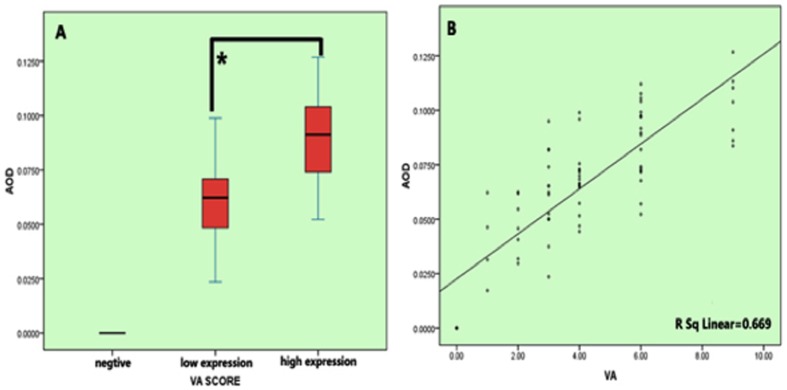
Figure 2. The relationship between the average optical density (AOD) scores of MACC1 immunohistochemical (IHC) staining obtained in Image Pro Plus anaysis and the staining intensity scores determined by visual assessment.
(A), Patients with RPC were manually divided into three groups according to their visual assessment scores in IHC stained tissue sections (negative, low MACC1 expression group, and high MACC1 expression group, respectively). The AOD value of MACC1 obtained from Image Pro Plus analysis was evidently increased in the low MACC1 expression group compared to the negative group, and was further elevated in the high MACC1 expression group (p<0.001). AOD = the integrated optical density (IOD)/Area of positive MACC1 staining in each IHC staining image; B, Spearman correlation coefficient analysis measuring the strength of the linear relationship between MACC1 AOD Image Pro Plus scores and visual assessment scores. A statistically significant positive linear relationship was observed between these two sets of scores in RPC (r = 0.669, p<0.001).

