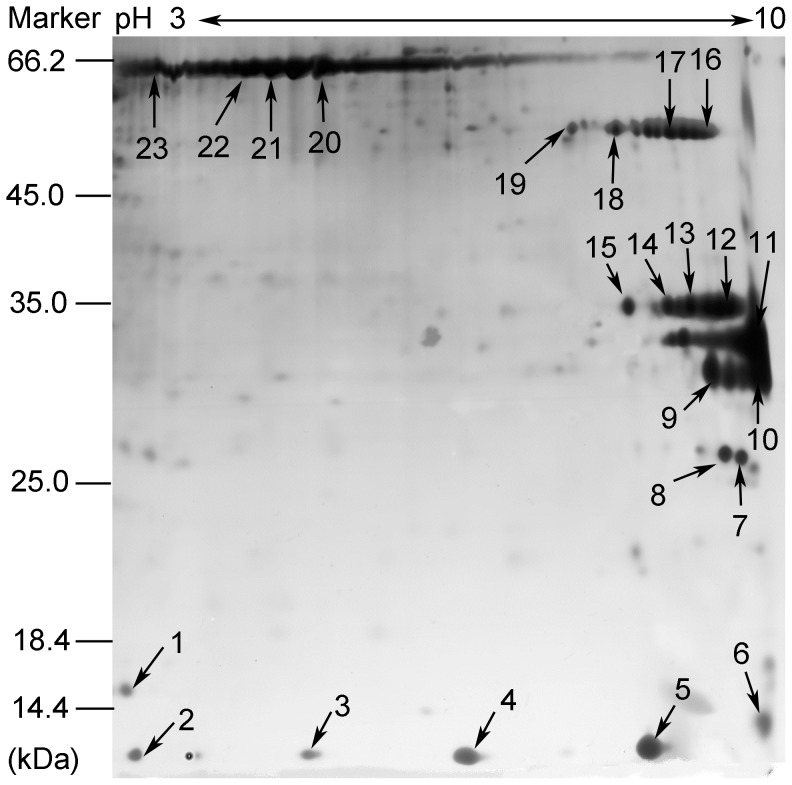
Figure 1. Profile of surface-exposed proteins in R. rickettsii.
The isolated biotinylated proteins (300 µg) of R. rickettsii were separated by isoelectric focusing electrophoresis with a pH 3–10 strip followed by 12% SDS-PAGE. The protein spots in the gel were numbered from 1 to 23 and subjected to ESI-MS/MS analysis. The relative molecular masses of the marker proteins are indicated in kDa on the left side of the figure and the proteins identified by ESI-MS/MS are listed in Table 1.

