
Figure 4.
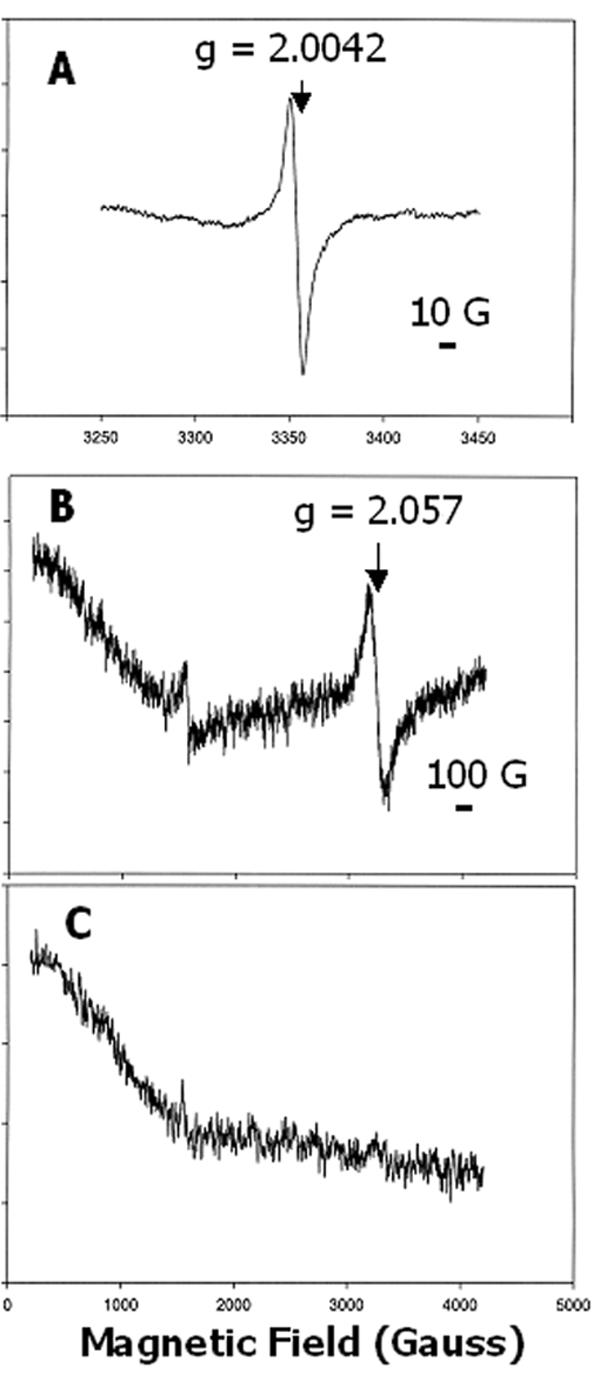
EPR spectra of CAO expressed in E. coli. (A), Spectrum of a membrane fraction on an expanded x-axis to indicate the isotropic character of the g = 2.0042 radical; 12 scans; 14 K. (B), Spectrum of a membrane fraction after wash with 0.1 mM EDTA and addition of Chl a (5 μM), which revealed the broad, isotropic character of the g = 2.057 signal; 4 scans; 7 K. (C), Sample as in (B) after addition of mercaptoethanol (0.5%, v/v); 1 scan; 7 K. The bar in panels (A) and (B) indicate the magnetic field scale. The y-axis of the spectra was expanded by a factor of 5 for (B) and 10 for (C), relative to the spectra in Figure 3A, for presentation of the data.