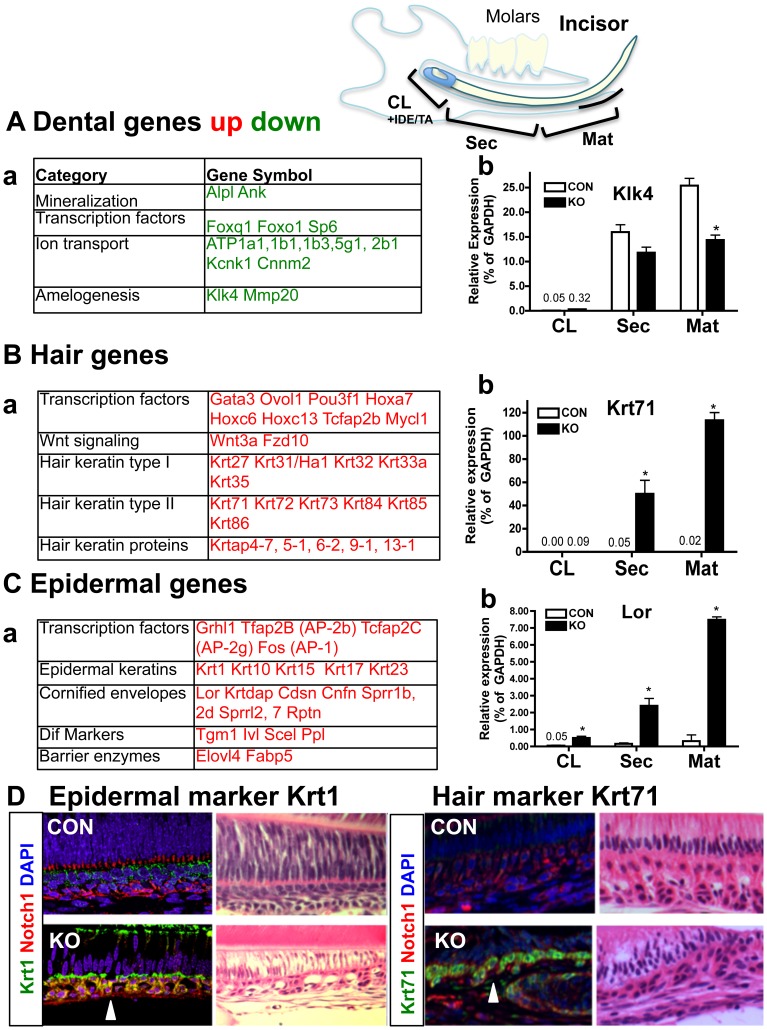
Figure 2. Med1 ablation prevents dental fate but drives epidermal fate.
The IPA pathway analysis on 4(A) The expressions of dental genes were decreased in KO at the Mat stage. Instead, hair genes (B) and epidermal genes (C) increased in KO at the Sec and Mat stages. The full list of altered genes with fold changes and detailed information is shown in Tables S1, 2 and 3. Green letters indicate down-regulation and red letters indicate up-regulation. The mRNA levels of representative genes for dental (A, b Klk4), hair (B, b Krt71), and epidermal (C, b Lor) are confirmed by QPCR. The average and SD of relative expressions (% of GAPDH) in CL, Sec and Mat at 4 wk are shown. The numbers show the value of the relative expression, which are too low to represent using bars. The statistically significant increases/decreases in Med1 KO (closed bars) compared to KO (open bars) at each stage are shown by asterisks (n = 3, p<0.05). (D) Immuno-staining of epidermal keratin Krt1 (left) and hair keratin Krt71 (right) (Krt1 or Krt71 green, Notch1 red, DAPI blue) in the Med1 KO and CON at 4 wk. Equivalent sections stained by HE are presented on the right side of each image.

