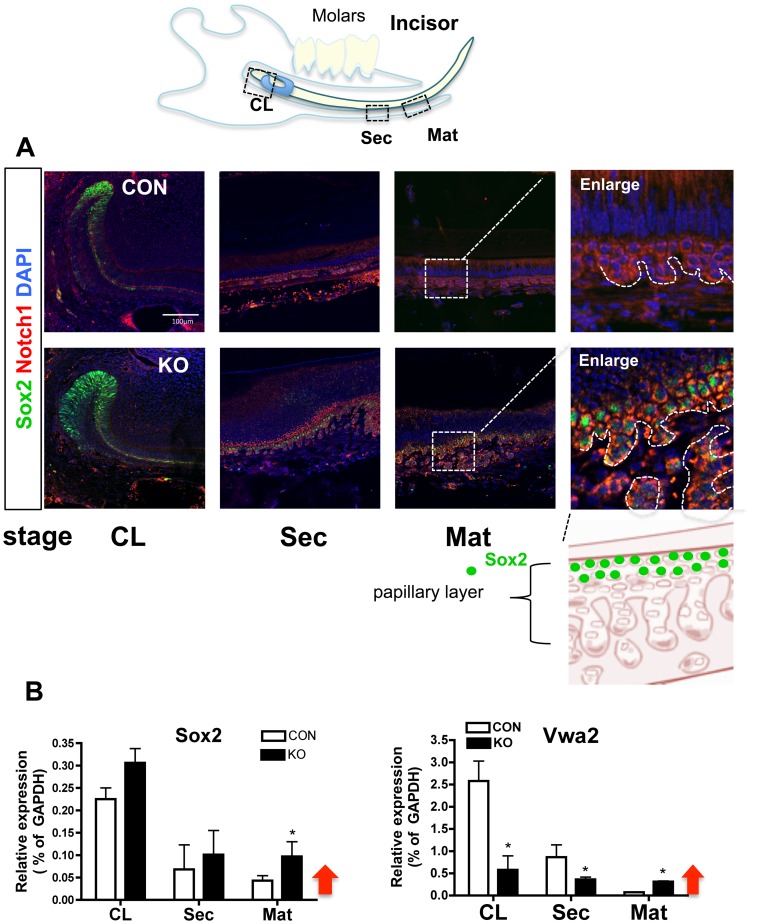
Figure 4. Med1 ablation extended Sox2 and stem cell signatures.
(A) Stem cell marker Sox2 expression in dental epithelia at three different stages; the CL (left panels), the Sec (second left), and the Mat stage (third left) in Med1 KO and CON at 4 wk (green Sox2, red Notch1, blue DAPI). The location of the 3 stages is shown in the upper diagram. Enlarged images of the boxed area of the Mat stage are also shown (far right panels), and papillary structures are indicated by dotted lines. The lower diagram shows the location of Sox2 (green) in the papillary layer. (B) The mRNA expression of Sox2 and Vwa2 at three stages (CL, Sec, and Mat) in KO (closed bars) compared to CON (open bars) at 4 wk. The SD of relative expression (% of GAPDH) and the statistical significance (n = 3, * p<0.05) are shown. Red arrows indicate their retention in the Mat stage in KO.

