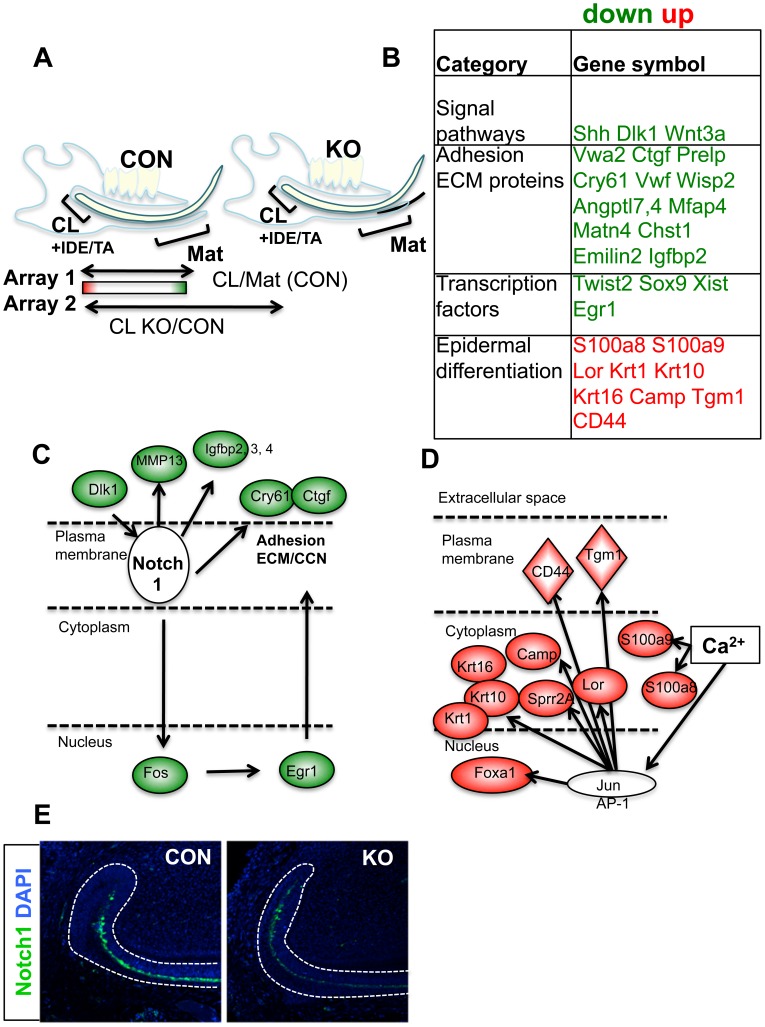
Figure 5. Gene expression profiling predicted changes in Notch and calcium signaling upon Med1 deletion.
(A) Strategy of microarray analyses. CL and Mat tissues were dissected from Med1 KO and CON mice at 4 wk and 10 wk. Array 1 calculated fold changes in CL/Mat in control mice revealed genes that are enriched in CL compared to the Mat stage, which are DE-SC signature candidates. Array 2 calculated fold changes in KO/CON at CL shows genes up-or down-regulated in Med1 KO compared with CON. Arrays were performed on RNA samples from Med1 KO and CON. (B) These analyses revealed a list of DE-SC signatures affected in the CL of Med1 KO in comparison with gene pools identified through other stem cells of ESC or HF-SC. Green letters show down-regulation, and the red letters indicate up-regulation. Fold increases and other details are listed in Table S4 (10 wk). (C, D) The IPA pathway analysis predicted that Notch1 (C) and calcium (D) are potential upstream regulators to cause these changes in Med1 KO. The sub-cellular location and the up- and down-regulation of genes are shown by red and green, respectively. (E) The protein expressions of Notch1 at 4 wk are shown in CL of Med1 KO and CON.

