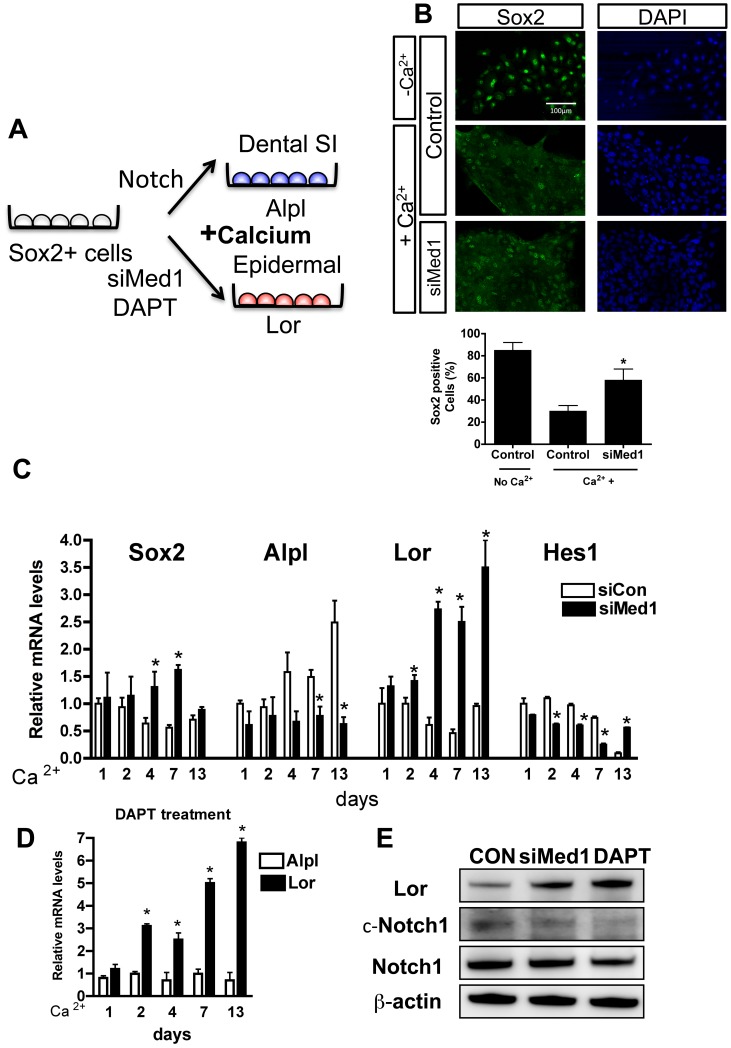
Figure 6. Med1 regulates cell fate through calcium and Notch signaling.
(A) Cervical loop derived dental epithelial (CLDE) cells were established, and Med1 was silenced by siRNA (siMed1). (B) Sox2 was present in CLDE cells that were maintained in low calcium (upper panels), was decreased in high calcium (1.5 mM) (middle panels) (4 days culture), but sustained in siMed1 cells in high calcium (lower panels) (Sox2 green, DAPI blue). The numbers of Sox2 positive cells were counted (bar graph). (C) Control (open bars) and siMed1-treated cells (closed bars) were maintained for 1–13 days in 1.5 mM calcium, and the mRNA expression of Alpl (blue in A), Lor (red in A), Sox2, and Hes1 were measured. Data are shown as the mean±SD of triplicate measurements. The statistically significant increases or decreases in siMed1 compared with sicontrol at each stage are shown by asterisks (p<0.05). (D) Notch inhibitor DAPT suppressed the induction of Alpl, but induced the expressions of Lor (* p<0.05) when cells were maintained in a high calcium condition. The control mRNA level at Day 1 without DAPT for Alpl or Lor was set as 1. (E) The protein levels of Lor, cleaved Notch (c-Notch), total Notch, and the loading control β-actin (4 days in high calcium) are shown by the Western blot analysis. The results were reproduced in two different batches of CLDE cells.

