Figure 5.
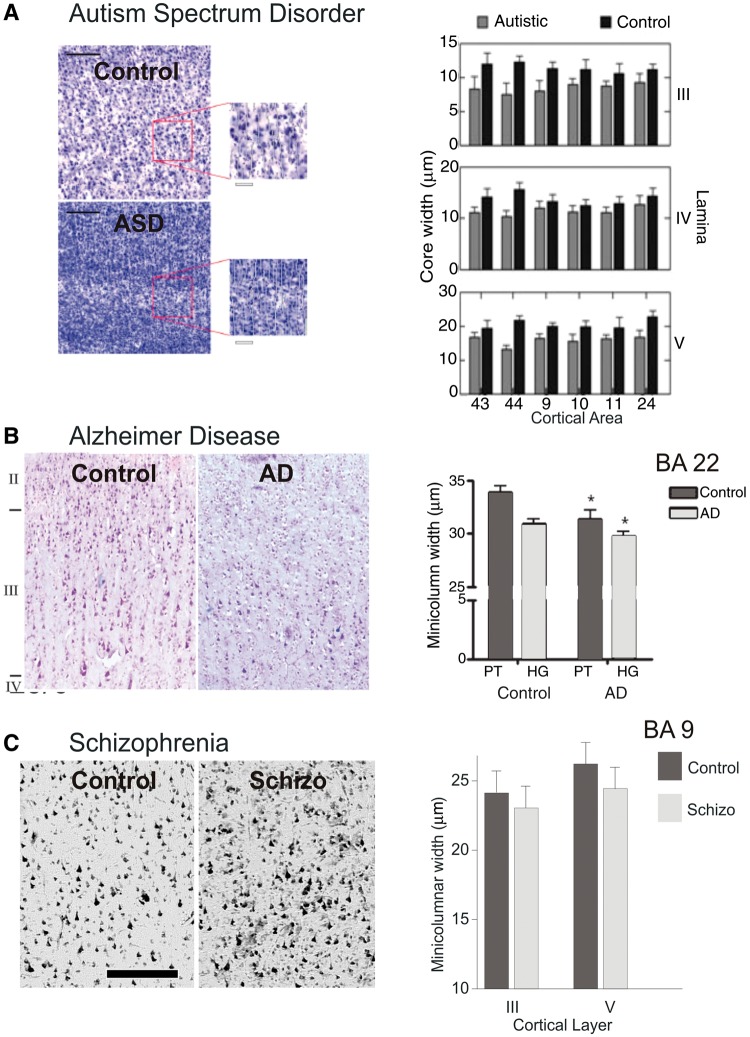
The pathology of cortical minicolumn in disease. (A) Example of prefrontal cortical minicolumn in an autistic patient compared with a normal control subject (left). Comparison of the minicolumnar width in autism versus normal control subjects for layers III, IV and V, across prefrontal Brodmann areas 9, 10, 11, 24, 43 and 44 (Casanova et al., 2002a, 2003a, 2010). (B) Example of prefrontal cortical minicolumn in a patient with Alzheimer's disease (AD) as compared to a neurotypical subject (left). Comparison of the minicolumnar width in Alzheimer's disease versus normal control subjects for planum temporale (PT) and primary auditory region of Heschl’s gyrus (HG), of prefrontal Brodmann areas 22 (Chance et al., 2011). (C) Example of prefrontal cortical minicolumn in schizophrenic patient compared to normal control (left). Comparison of the minicolumnar width in schizophrenic versus normal control subjects for layers III and V, across prefrontal Brodmann area 9 (Casanova et al., 2008). Bar length was 250 µm. Adapted from Casanova et al., 2008, 2010; and Chance et al., 2011.

