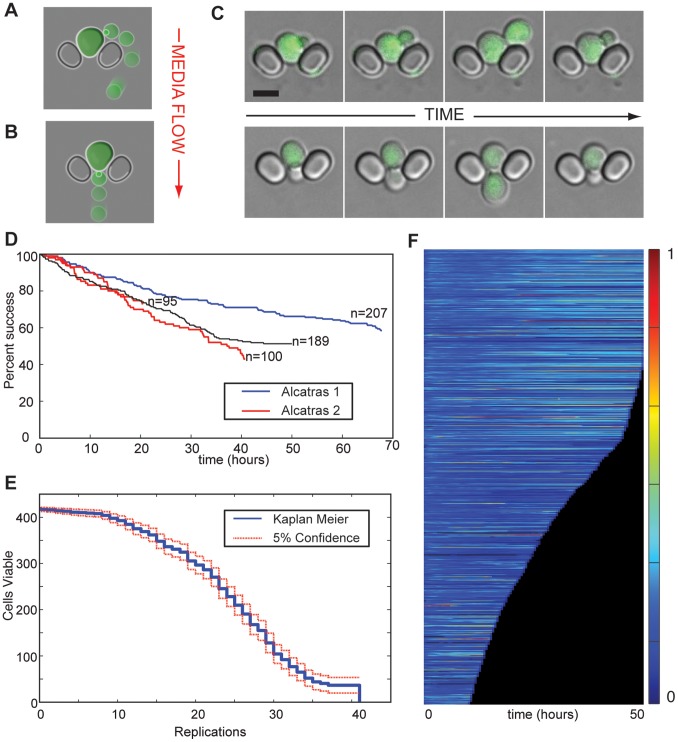
Figure 2. Operation of ALCATRAS.
A, B) Schematics showing the removal of a daughter cell by the media flow when the mother buds at the top of the trap (A) or at the bottom (B). In both cases the flow is from top to bottom (red arrow). The newly formed daughter cells follow the streamlines shown in Fig. S1A. C) Microscopy images of removal of daughter cells in the device. The cells are expressing Doa1p-GFP, and the fluorescence image has been overlaid with the DIC image for clarity. Scale bar indicates 5 µm. D) Success rates for four ALCATRAS experiments. The number of cells retained in their original traps over the time course is plotted for two independent experiments using each of ALCATRAS 1 (red – more dense spacing of traps) or ALCATRAS 2 (blue – less dense spacing of traps). Only cells that were present in the traps at the first time point are included. Results were scored manually from a random subset of the fields imaged. Numbers include cells that have visibly died during the experiment. For a more detailed breakdown of cell loss and replacement, see Fig. S3. Flow rates were 2 µl/min from each input syringe pump (4 µl/min total). E) Cell viability plotted as a function of the number of replications (n = 422). Cells were observed for 62 hours, and replicative lifespans were scored manually. The mean lifespan is 22.4. Flow rates were 2 µl/min from each input syringe pump (4 µl/min total). F) Kymograph showing Hsp104-GFP expression over time with imaging every 10 mins. The median fluorescence intensity within the area of each cell (n = 1003) at each time point is shown by the colour map. Only cells that are present during the first hour of the experiment and that remain in their original traps for at least 10 hours are shown.

