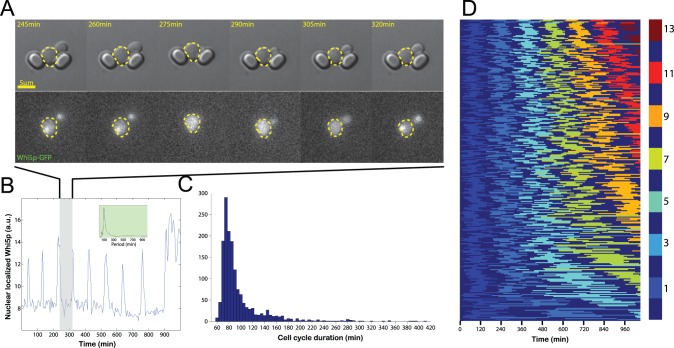
Figure 3. Cell cycle dynamics in ALCATRAS.
A) Frames from a time-lapse movie showing a cell expressing Whi5p-GFP across one cell cycle. Fluorescence is localized in the nucleus during late M and early G1 phases. B) Plot of the nuclear localization of Whi5p over time for the cell shown in A. Frames in A are from the shaded period. Over many hours the cell undergoes a large number of cell cycles, resulting in a strongly periodic signal. The inset shows the power spectrum derived from applying Welch’s windowing algorithm and the Fourier transform to this data with a single peak at the frequency of the cell cycle. C) Histogram showing the distribution of cell cycle times of mother cells undergoing their first three divisions in ALCATRAS. D) Kymograph illustrating the change in replicative age of individual cells during the experiment. To aid visualization of the cell cycle, each alternate division is marked by a different colour. The total number of divisions undergone in the device when odd is shown by the colour map; even numbers of division are depicted in dark blue. Cells have been ordered by their number of divisions, and only cells that remain alive and in their original traps throughout are illustrated (299 cells). Flow rates were 2 µl/min from each input syringe pump (4 µl/min total).

